Selector Analytics is a next generation AIOps solution to automate anomaly detection for hybrid-cloud connectivity and applications
SRE/NetOps face three critical challenges today:
- Collection: Analysis that leverages metrics from all available data sources,
- Correlation: Identification of meaningful anomalies with fast correlation, and
- Collaboration: Integration of insights into messaging platforms.
With the increase in mission–critical and performance–sensitive services executing across geo–dispersed hybrid data centers, network outages directly impact business revenue. SRE/NetOps spend a majority of their time identifying the failures and their sources. Existing monitoring tools utilize domain–specific siloed datasets, and SRE/NetOps have to cross both organizational and tool boundaries to draw actionable insights. Forrester’s AIOps 1 report highlighted this challenge which states that cross–team collaboration makes an AIOps tool more effective.
Selector AI is an operational intelligence platform that automates anomaly detection and helps diagnose outages for hybrid–cloud connectivity and applications. Selector AI collects data from heterogeneous data sources, applies an ML–based data analytics approach, and provides actionable multi–dimensional insights by correlating metrics and events. Our customers can collaborate and share insights on various messaging platforms (Slack and Microsoft Teams) using search–driven querying with a conversational chatbot experience.
Gartner reported 2 that the share of AIOps tools to the full suite of monitoring tools for applications and infrastructure would rise from 5% in 2018 to 30% in 2023.
Collect from a variety of sources
Ingest variety of data sources in various formats
Correlate metrics and events machine learning
Machine Learning based data analytics for automated anomaly detection
Collaborate across boundaries
Instant actionable insights on collaborative platforms using Natural Language Queries (NLQ)
Collect
With the Selector AI data pipeline, familiar data sources are pre-integrated. It can ingest data from sources such as SNMP, gNMI/gRPC, InfluxDB, Kafka, Prometheus, REST API, vendor-specific device metrics, GitLab, GitHub, and Splunk. Additional data sources can be added with YAML file definitions and do not require a change to the data pipeline. As we encounter new use cases, we continue to add new data sources.
In one scenario, the customer uses Telegraph agents to collect metrics from various sources and writes them to InfluxDB. Selector AI reads data from InfluxDB using GET API calls. In another scenario, Selector AI is reading metrics from Kafka’s message bus. As the data collection engine of Selector AI receives a high volume of data and requirements are bounded by the velocity of data, we wrote collection engine in Go to achieve high throughput.
The collection layer can also ingest proprietary databases in CSV file format and join tables across relational databases and time-series databases. This join helps to get contextual insights that map user-defined tags such as customer and user to operational tags such as port, server, and switch.

Correlate
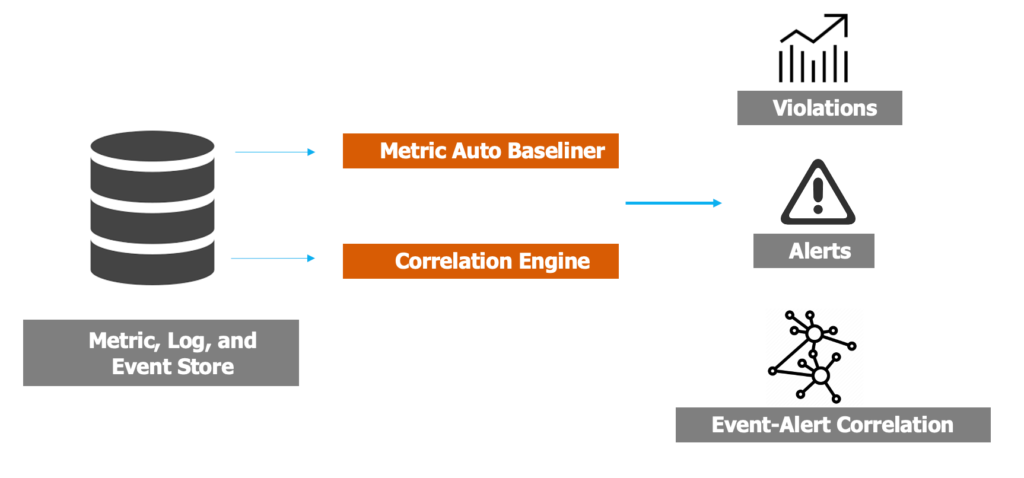
Selector AI normalizes, filters, clusters, and correlates metrics, events, and alarms using pre-built workflows to draw actionable insights. Selector AI adds automatic baseline bands by monitoring each metric’s past behavior and alerts when an anomaly is detected. Users are not required to set baselines and thresholds for thousands of metrics. For peer group metrics, cross-correlation detects outliers that differ significantly using statistical methods such as top violators, 3-sigma, and 99-percentile.
With auto/cross-correlation of metrics and events from heterogeneous data sources, Selector AI uses a ranking system to shortlist factors responsible for an outage. Users can get to the root cause of an outage faster by focusing on this ranked list. With automatic alert notification for an SLI or KPI violation, Selector AI presents a list of correlated metrics and labels, reducing the diagnosis time. Data science experts can customize the Selector AI data pipeline, and teams early in the data science journey can use it as-is.

The key technology used in this stack is a local metric, log and event data store, and multiple data processing engines to detect anomalies, violations, and correlations. We use open-source databases such as Prometheus to store time-series data, Loki for logs, Postgres for relational data, and MongoDB for NoSQL data. With our focus on data-centric AI, we apply multiple models to improve data quality.
For example, we use LSTM (Long short-term memory) based deep learning techniques for anomaly detection and auto-baselining. We use the techniques of Recommender systems to identify correlations between different metrics, logs and events. We implemented most of this using PyTorch, a software machine learning library in the Python programming language.
Collaborate
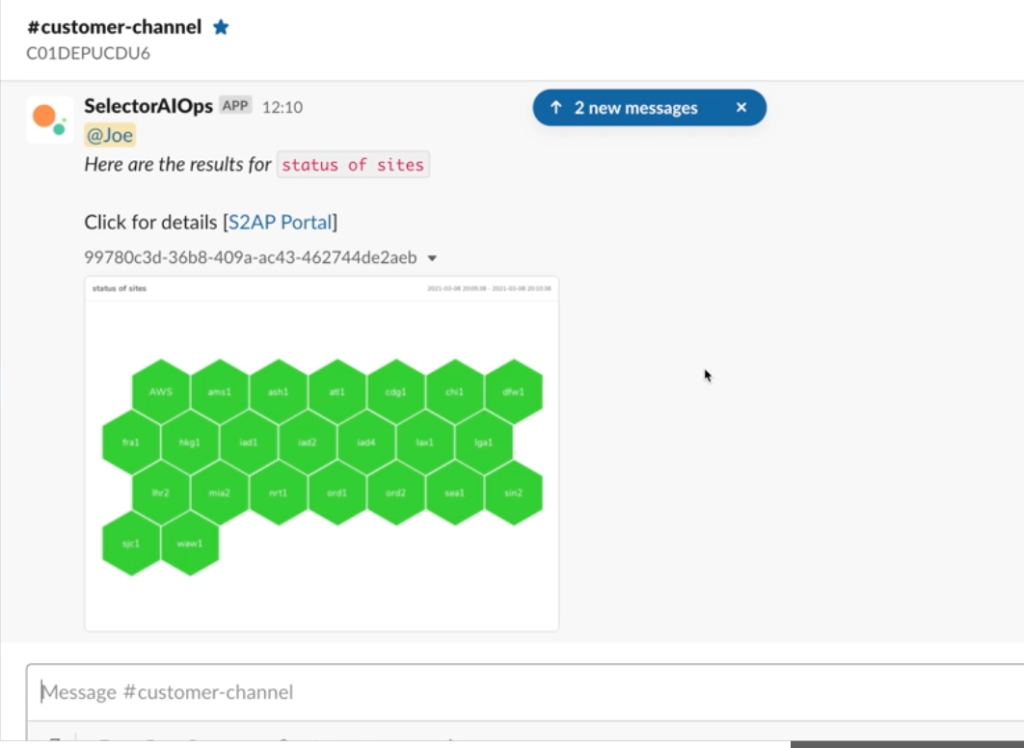
Both technical and business leaders want to get short and instantaneous status reports without writing SQL queries, and building new widgets or dashboards. To enable this desire for data democratization, Selector AI supports Natural Language Queries directly integrated into common messaging platforms such as Slack and Microsoft Teams, providing a conversational chatbot experience. Selector AI’s collaboration service engine learns from labels associated with metrics and events. It infers natural
language queries and finds the closest match. A fully interactive web portal with on-demand dashboards and a structured query language are available for expert users. In the web portal, users can build widgets and dashboards using Query auto-complete. Using high-performance APIs, users can share query outputs and dashboards with larger workflows such as IT-service management ticketing, alerting, and automation tools.
The key technology components used in this layer are for Natural Language Processing (NLP) and interactive query interface in Slack/Team and portal. For NLP, we use spaCy, an open-source software library to build models for advanced natural language processing. User asks queries in natural language and our models will translate them into underlying SQL queries. The interactive web portal is built using Javascript and React with visual rendering using Highcharts.

The key technology used in this stack is a local metric, log and event data store, and multiple data processing engines to detect anomalies, violations, and correlations. We use open-source databases such as Prometheus to store time-series data, Loki for logs, Postgres for relational data, and MongoDB for NoSQL data. With our focus on data-centric AI, we apply multiple models to improve data quality.
For example, we use LSTM (Long short-term memory) based deep learning techniques for anomaly detection and auto-baselining. We use the techniques of Recommender systems to identify correlations between different metrics, logs and events. We implemented most of this using PyTorch, a software machine learning library in the Python programming language.


Collection layer
Being Kubernetes-native, this layer is extensible and can scale up and down based on the volume of data ingestion.
Correlation/machine-learning layer
We do not keep a full copy of ingested data. Instead, we store derived metrics, anomalies, and associated events to respond to queries. With the approach, this layer can respond to user queries faster and not scale linearly with the volume of data ingested.
Collaboration layer
We have developed a new description language called S2ML (Selector Software Markup Language). S2ML is used to describe data relationships in a SQL database, aggregates, and data dimensions. An advanced user can use S2ML to extend the Selector AI platform for their custom use case, and can write a model in S2ML to construct SQL queries and on-demand dashboards.