Selector CUSTOMER Case StudY
Selector Analytics Enables Real-time Monitoring of Live TV for a Major Cable Operator
About The Customer
- Canada’s largest telecommunications company
- Over 2.7 million cable subscribers in 2021
- IPTV Delivery with Multicast
Selector Data Inputs
- Kafka
- SNMP Traps & Syslog
- NGCE channel name and
- flow rate
- Custom Inventory

“Our goal is to keep service up and always. With Selector Analytics, we are constantly monitoring availability and performance. If an abnormal condition arises, we take immediate action.”
Senior Manager
Video, Network, and Infrastructure
The Challenge
Delivering cable TV service across numerous markets in a large company can be challenging and complex. The sheer number of network elements involved and how the video is delivered across the network present several unique challenges. For this customer, one of the largest telecommunication companies in Canada, the video is delivered across the network with IP multicast, a feature of the Internet Protocol which is notoriously difficult to troubleshoot.
In this large organization, various layers of the network are managed by different groups using different systems. It was common for multiple teams to be involved in incident resolution specific to the channel with multicast information. Teams were dependent on manual correlation and spreadsheets to share information. The result was often chaotic, leaving IT teams strained and scrambling to resolve these issues on time.
With more than 2.7 million TV cable subscribers in Canada alone, delivering reliable service in a highly competitive market is critical. When the company was facing degraded TV services and frequent interruptions, they turned to Selector to deploy a real time end-to- end monitoring solution.
Customer Objectives
- Simplify a complex environment by bringing together data from different silos into a single pane of glass
- Quickly pinpoint the root cause of customer-impacting issues
- To ensure services are up and running and free of interruptions
The Selector Analytics Solution
Selector provided the organization with an end-to-end, real-time monitoring solution for their entire service. By ingesting data for all the key network elements involved in delivering the service and integrating with customer inventories, IT teams are equipped with an easy-to-use and intuitive dashboard for a clear view of all relevant data.
Network and Media Delivery Overview
The Selector Analytics solution provided a holistic view of the service to include every element of its delivery, from the application stack down to the routers, switches, and transport equipment. While it’s common for network failures to occur, most do not impact the application because of the redundancy that is built into the design. What’s more, not all application failures are a direct result of the network. A simple, yet intuitive dashboard provided by Selector, allowed the IT teams to isolate where the problem(s) may occur and their level of severity.
Teams can drill down for a deeper dive into specific problem areas of the network to identify the root cause of the issue.
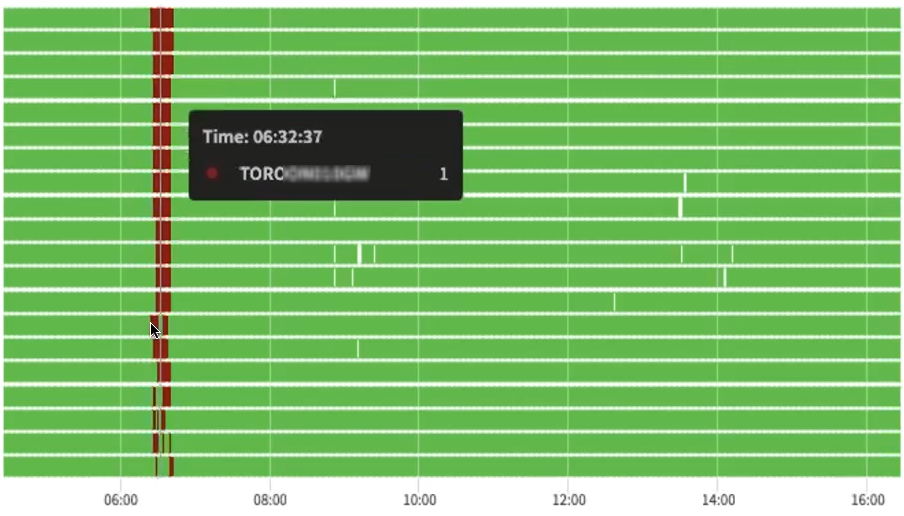
Multicast Group and Source Health
Before Selector was deployed, the process of checking channel health was complex. Examining each channel and verifying multiple metrics to ensure the channel was healthy is not only a labor-intensive process but very time consuming and prone to error.
Now, Selector Analytics is bringing all these metrics into a single system to derive new metrics for health. The only requirement is typing in the name of the channel and all the relevant metrics and health indicators are readily available.
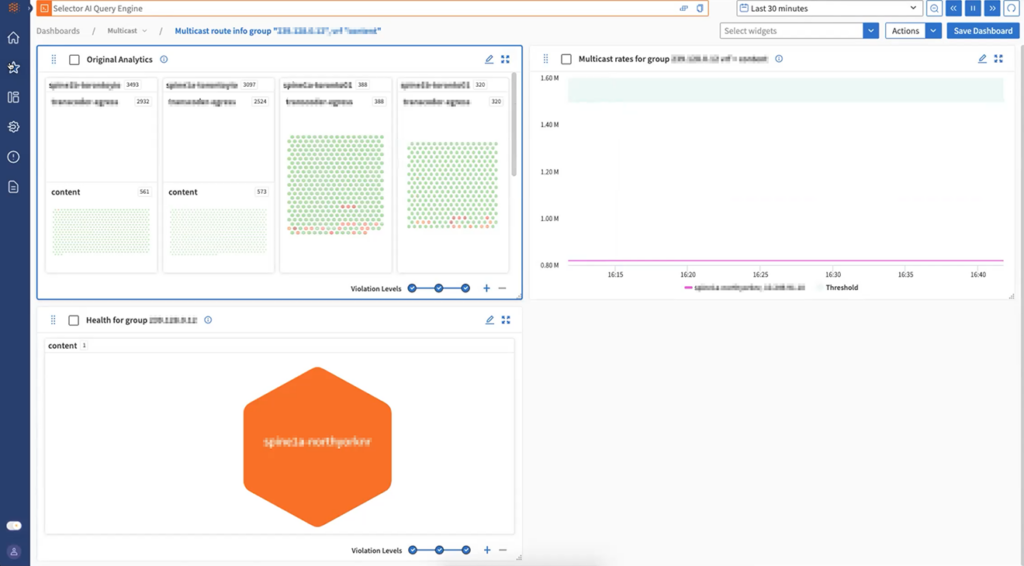
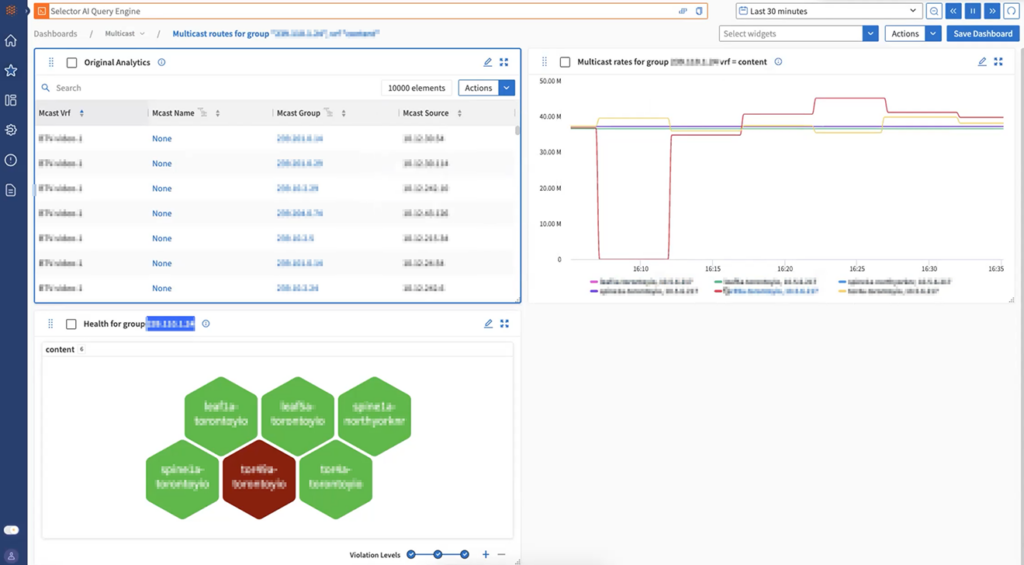
Root Cause Isolation
By investigating the problem from different angles, the process of isolating the problem area in the service is simplified. Teams can quickly pinpoint whether a channel is down for all sites, a specific site, a specific customer or if all channels are down for any given site.
Once the problem area has been identified, drilling down into dashboards will provide further information for faster resolution. Teams will have a holistic view of interface error charts, Syslog messages, SNMP traps, and any other relevant data sets that has been delivered to Selector Analytics.
Results
Taking a complex environment and simplifying it for multiple teams across various departments is the true value Selector Analytics provided for the organization. A single pane view that displays accurate, real-time correlated data can now be easily accessed across multiple teams for faster troubleshooting and performance monitoring. Now, teams no longer struggle to solve a problem that doesn’t exist, allowing them to dedicate their efforts on what matters most: keeping the service up and running and keeping customers happy.