Selector offers comprehensive monitoring, observability, and AIOps solutions for service providers and enterprises. The process begins with collecting, aggregating, and analyzing multi-domain operational data from various sources, such as SNMP, streaming telemetry, syslogs, and Kafka. Selector then applies advanced AI/ML techniques to power features such as anomaly detection, event correlation, root cause analysis (RCA), smart alerting, and a conversational GenAI-driven chat tool, Selector Copilot.
We decided early on that these capabilities would help us observe our own customer deployments. In this post, we’ll explore why we chose to leverage Selector to monitor Selector’s customers.
The Foundation: Kubernetes
Depending on the nature of an organization’s infrastructure, customers elect to deploy Selector on-premises (on-prem) or in the cloud. To address this, the founding engineers at Selector leveraged a Kubernetes native stack. This approach enables our team to deploy the same software on-prem and in the cloud.
While a Kubernetes-based microservices architecture enables a uniform deployment experience, it does introduce operational complexities for Selector’s site reliability engineers (SREs).
Specifically, how does a Selector SRE determine a “healthy” Selector Instance? It all comes down to monitoring a complex list of Key Performance Indicators (KPIs). Below are some critical KPIs that are indicative of an instance’s good or bad health.
- Is the Kubernetes (K8s) control plane running well?
- Is the load uniformly distributed across the compute nodes?
- Is there enough storage? Is disk usage steadily creeping up, and do we need to add more before losing data?
- Has the data ingest stopped from any source?
- Has a service crashed?
- Do we need to scale out because of the high offered rate?
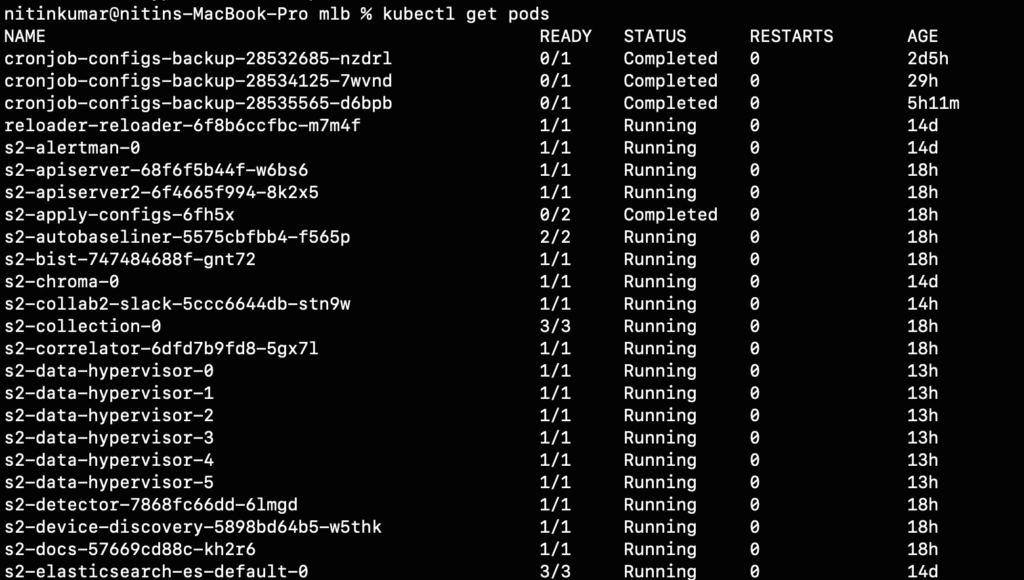
The challenge increases in scale and complexity due to hundreds of microservices running on an instance. The figure below shows a brief set of microservices that typically run in a production-grade deployment.
Why We Chose Selector
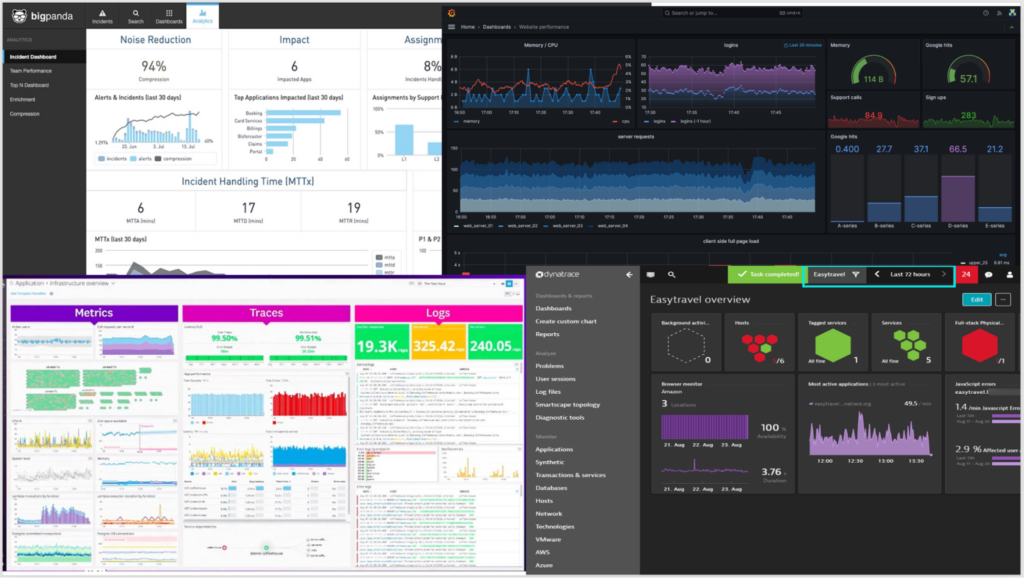
Selector could have used any 3rd party tool such as DataDog, BigPanda, Dynatrace, or Grafana. However, each tool only monitors a specific element, such as service, compute, or Kubernetes clusters. As a result, it can only provide a partial view of all building blocks together. Moreover, integrating a third-party monitoring solution for the Selector platform could invite some challenges, such as:
- They require the deployment of agents, which is not feasible due to our customers’ security policies.
- It is very hard — essentially impossible — to customize the analytics.
- A maze of dashboards made it impossible for our SRE team to determine what went wrong quickly.
Due to the above limitations, we used Selector’s platform to observe our customer deployments. The capabilities that we offer to our customers would be very advantageous to our SRE teams.
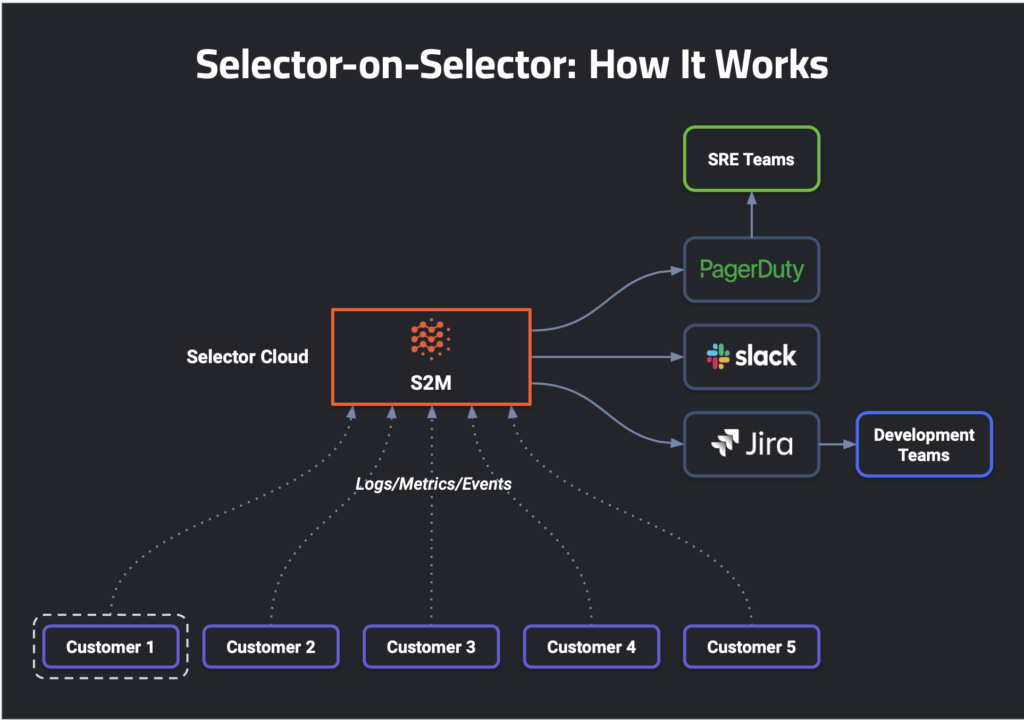
Selector’s platform, Selector Software Monitor (S2M), ingests metrics and logs from all customer instances. We started collecting a few thousand metrics from customer instances, but today, each instance emits more than a hundred thousand metrics. After ingesting all the metrics and KPIs, S2M does event correlation and deduplication, providing meaningful insights. If an issue is detected, the platform fires an alert on collaboration channels such as Slack, Microsoft Teams, etc. It enables our SREs to perform quick RCA of an issue, thus reducing the mean time needed to detect (MTTD) and repair (MTTR).
An Example Workflow
The platform automatically detects and correlates abnormal issues in real-time. When the platform identifies a new problem, a correlation alert gets published to Slack:
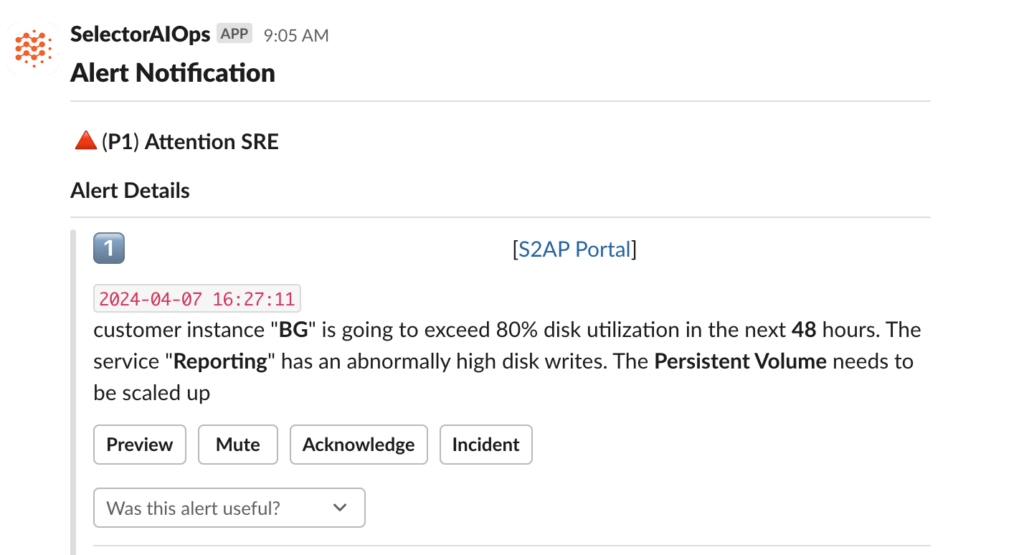
The following standout about this alert:
- Proactive: The SRE has been informed that disk utilization will exceed 80% in the next 48 hours.
- Root cause: The alert indicates the suspected microservice – “Reporting.” So, the bug/defect gets assigned to the right developer.
- Actionable: The alert tells the SRE precisely what to do, i.e. Increase the Persistent Volume Allocation.
- Workflows: SRE can create an incident from Slack with a single click, which kicks off the triage actions.
The SRE can investigate the issue by clicking the Selector Software Monitoring (S2M) URL. The honeycomb dashboards below show a detailed view of the Customer BG instance. The platform goes deeper and provides insight into the service/KPI spiked in utilization. For example, the persistent volume (PV) is the offending KPI in the scenario below.
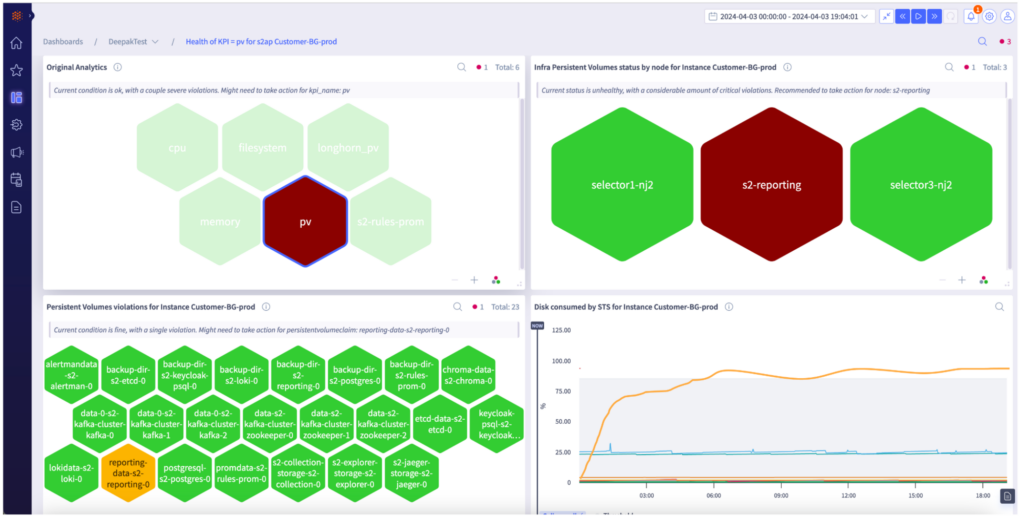
The SRE can then create JIRA tickets by right-clicking on the widget. The above example shows the complete automated workflow provided by the Selector platform, from alerting to identifying, analyzing, tracking, and closing an issue.
Summary
Selector-on-Selector is like monitoring a large-scale, highly distributed Software-as-a-Service (SaaS) application. Large applications require almost real-time observability and monitoring, which Selector’s product delivers. The platform’s ability to ingest data from any source, perform deduplication and correlation to detect anomalies, and generate alerts on any collaboration channel makes it an ideal choice for monitoring the Selector instances.
This feedback mechanism empowers Selector SREs to understand customer pain points better and focus on meeting customer objectives.