
Here’s a question that sounds simple but isn’t:
When something breaks in your environment, how long does it take your team to agree on what they’re looking at?
Not how long it takes to fix it—that’s a different problem. I mean: how long does it take for everyone on the bridge to have the same basic understanding of what’s broken, where it started, and what it’s affecting?
If your answer is anything other than “pretty much immediately,” you’ve got a fragmentation problem. And chances are it’s costing you more than you think.
Consider the following scenario: alarms are flooding in. Multiple servers in the data center are unreachable. Applications are throwing connection errors. The war room comes online, and everyone — NetOps, infrastructure, the application team, and systems engineering — joins. Everyone opens their tools, and what do they see?
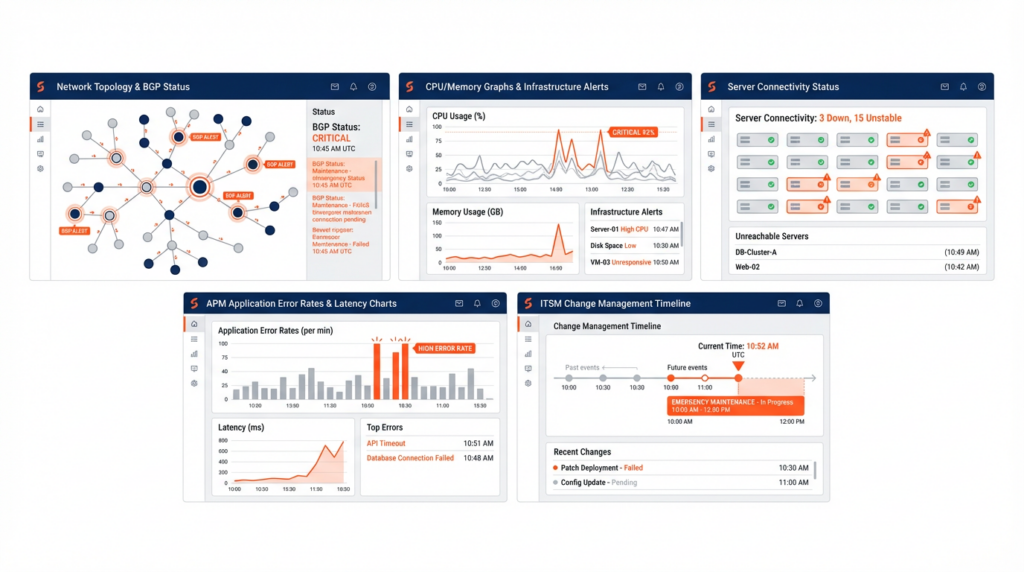
The network team sees a BGP state change. Peers went down, routes withdrew. Infrastructure sees high CPU alarms on the core router, followed by a line card reset. The server team’s looking at dozens of hosts that lost connectivity simultaneously. The application team sees cascading failures across services that depend on those servers. The NOC pulls up a configuration change that was pushed to the router forty minutes earlier.
So which one caused it?
The silence tells you everything you need to know.
Why Everyone’s Right, and Nobody Knows Why
The frustrating part about this type of scenario is that every tool is correct. The BGP flap is real; the high CPU and line card reset occurred. The servers lost connectivity, applications are failing, and a config change was deployed.
But somehow, even with all this data, you still can’t see what’s actually going on.
It’s not that you’re missing information; it’s that the information lives in five different places, and each place is telling you a different story. Every tool in your arsenal did its job effectively, but they aren’t talking to each other.
And that leaves you — at whatever ungodly hour this is happening — tabbing between dashboards, trying to build a timeline in your head, while someone on the bridge asks if you’ve checked whether the change was actually validated in staging.
The problem here is not the complexity of your systems. It’s that your understanding is in multiple different pieces.
The Architecture of Confusion
When five engineers look at five different dashboards and come away with five different theories about what’s broken and how to fix it, that’s not a failure of skill. It’s a failure of architecture.
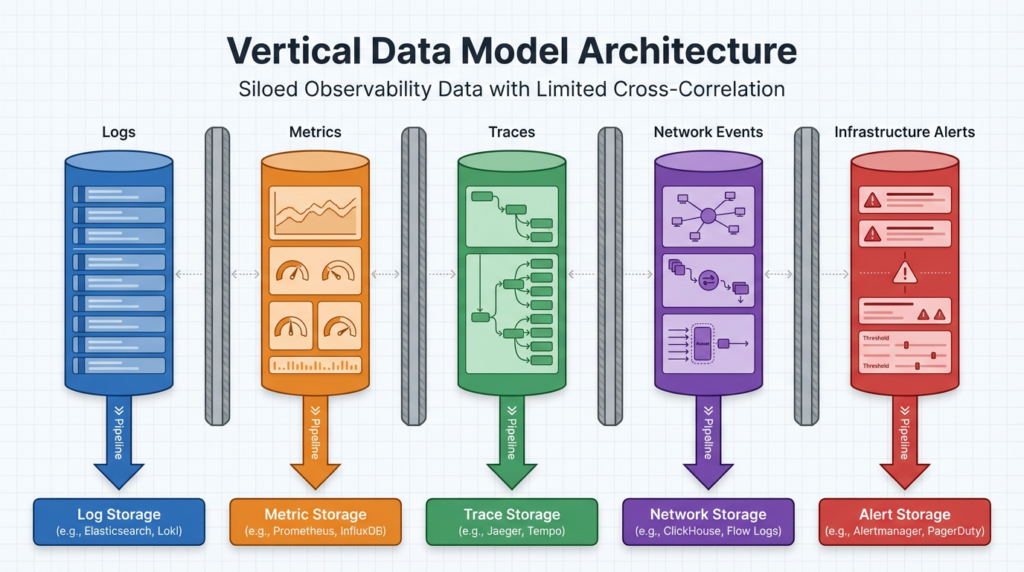
Most monitoring and observability platforms are built around what we consider to be a vertical data model. Data comes in and gets sorted by type. Logs go into the log pipeline, metrics go into the metrics pipeline, so on and so forth. Network events, infrastructure alerts, and application traces each get its own lane, its own schema, its own storage, and its own analytics.
Most platforms can ingest multiple types of data, but each type still lives in a silo. You can set up correlations — match timestamps, trigger alerts when two things happen at once — but those correlations are brittle and predefined. They know “if X, then Y” but they don’t know the why.
That’s the gap.
That’s why five smart people (often times a lot more than five) on a bridge call can look at the same incident and walk away with completely different understandings of what happened. The tools aren’t designed to give you a shared view. By nature, most of your tools are designed to optimize analysis within their own domain. So when something breaks across domains —which is, let’s be honest, most of the time — you’re left stitching the story together yourself.
And you have to do it manually, under pressure, while the alarms keep coming in.
What Changes When Data Speaks the Same Language
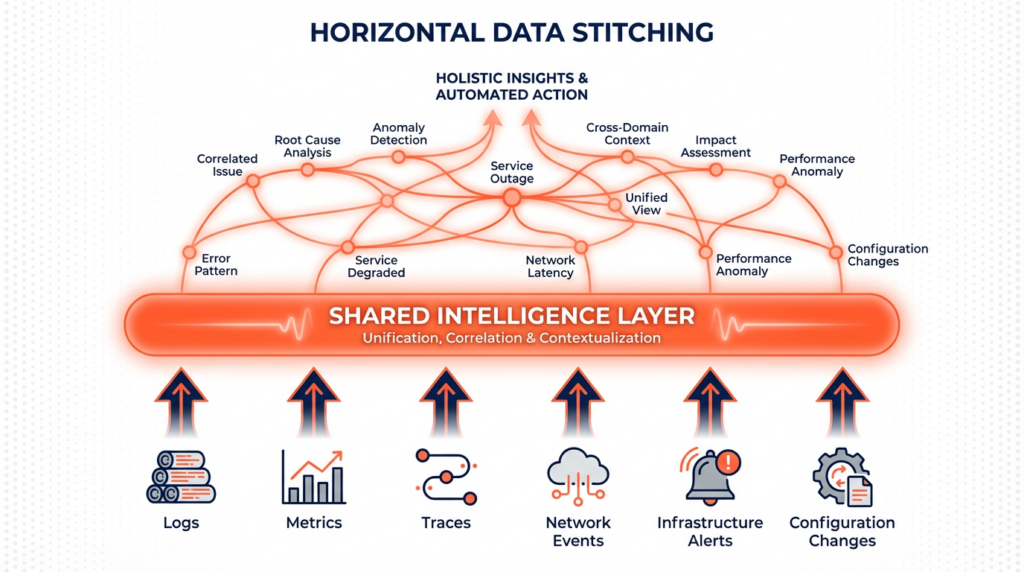
There’s a different way to do this. Instead of organizing data by type, you can organize it by relationship. We call this “Horizontal Data Ingestion”.
Selector doesn’t care if something is a log or a metric or a BGP event or a line card reset. It’s all knowledge, and we ingest it all — network telemetry, infrastructure metrics, application logs, topology data, change records, configuration pushes, even emails if that’s important to you. Then we use patented AI and ML models to figure out how it’s all connected.
We don’t ask you to tag things in advance. We don’t need you to define schemas. We don’t care if your infrastructure spans on-prem data centers, cloud, hybrid environments, or a mix of vendors that nobody planned but everyone has to live with.
We just ingest it. And then we learn it.
The models we use do three things:
- Figure out what the data actually means
- Normalize it into a shared intelligence layer where everything speaks the same language
- Correlate it horizontally, so you’re not just seeing patterns within one type of data, but how everything relates across your entire stack.
The result isn’t five dashboards with five stories (or more). It’s one operational view of what’s actually happening.
When correlation stops being about matching timestamps and starts being about understanding causality, the whole game changes. You stop pointing fingers and start solving problems.
Same Incident, Different Outcome
Let’s go back to that scenario. Alarms flooding, servers unreachable, applications failing.
But this time, there’s no war room.
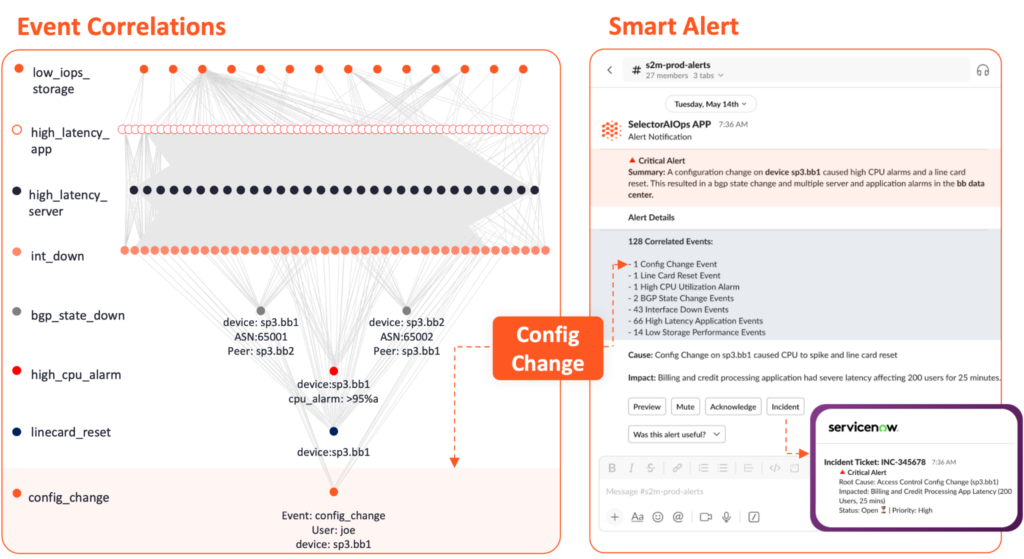
Instead, a Smart Alert hits Slack. One alert. Not dozens of of fragmented notifications across five different tools. The alert shows you everything:
- The full sequence of events: config change → CPU spike → line card reset → BGP peer down → route withdrawal → connectivity loss → application failures
- The causal chain, not just a list of symptoms
- Which services are impacted and how they’re connected
- The blast radius in real time
- Context from six months ago, when a similar config pattern caused issues in a different environment
And here’s the part that actually matters: the person who gets that alert understands what happened without needing to pull everyone else into the problem.
They see what broke, where it started, what it’s affecting, and what needs to happen next. If the need to escalate or create a ticket, there’s a button right there to push it to ServiceNow — with all the correlation, context, and causation already included.
No dashboard archaeology.
No manual timeline reconstruction.
No debate about whether this is a network problem or an infrastructure problem.
Just what happened, why, and how to fix it.
Selector isn’t just making incident response faster. We are fundamentally changing how incident response works.
Integrate First, Consolidate Later
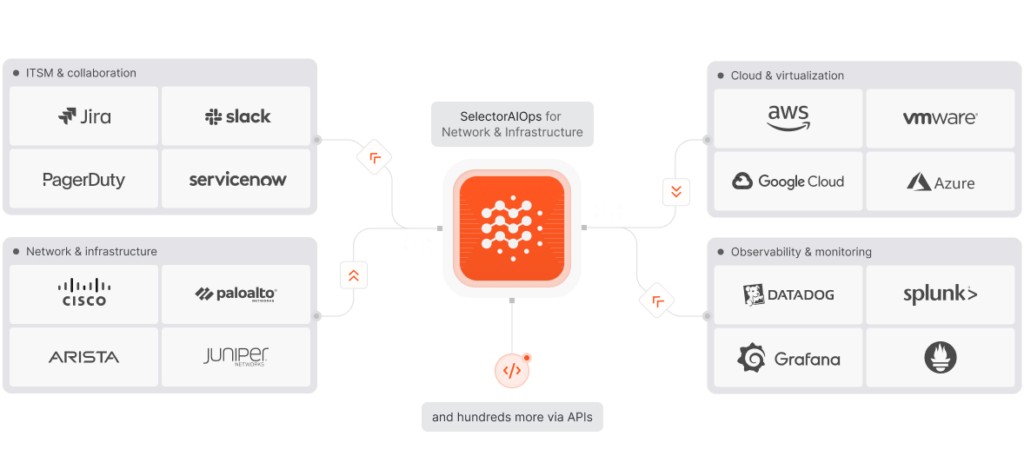
Look, we know you’re not about to throw out your network monitoring platform, your infrastructure tool, or that ITSM system you’ve been stuck with for years. We’re not asking you to. Selector works with what you already have. You integrate it with your existing stack, and it starts ingesting data from the tools you’re already using.
Pretty quickly, your teams start seeing things they couldn’t see before, like relationships across domains, patterns that were invisible when everything lived in silos, and the actual chain of causality instead of a bunch of coincidental timestamps.
And then — not immediately, but when you’re ready — you might start asking a different question: “Do we actually need all of these tools?”
Because once you can see which ones are giving you a real signal and which ones are just echoing each other, consolidation stops being a forced initiative and starts being a decision you can actually defend.
We’re not here to tell you what tools to use. We’re here to make them all work together so you can actually understand what’s happening. If that eventually leads you to simplify your stack? Great. But that’s your call, on your timeline.
Stop Paying the Fragmentation Tax
Most incidents don’t drag on because you’re missing data. They drag on because nobody can agree on what the data is telling them.
That disagreement has a cost, and we call it the fragmentation tax.
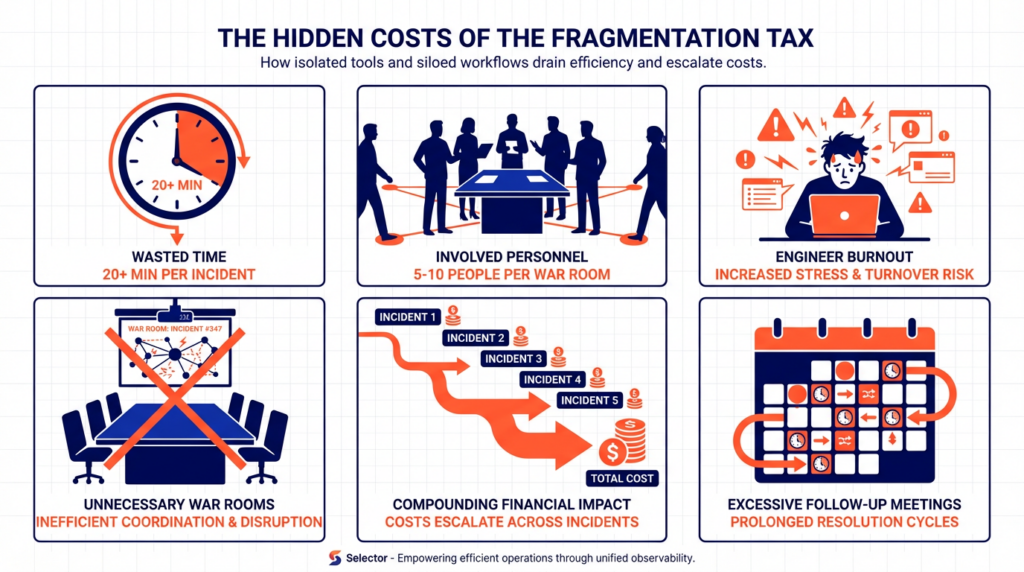
It’s the war room that shouldn’t have needed to happen. Its five people (or in our experience, usually a lot more) pulled away from other work to manually correlate what a system should have correlated automatically. It’s the first twenty minutes of every bridge call spent just trying to establish a shared timeline.
It’s the engineer tabbing between dashboards at 3 AM, trying to figure out which tool is showing the real story. It’s the follow-up messages to debate what actually happened. It’s the post-mortem where three people still have three different theories about the root cause.
You don’t see this cost in your incident metrics. MTTR doesn’t capture the time spent aligning. Your dashboards don’t measure cognitive overhead. But it’s there, every single time, and it adds up quickly.
The fragmentation tax isn’t paid once per incident. It’s paid by every person who touches that incident, in every conversation, across every handoff. It compounds.
Selector eliminates the tax entirely.
We do this by creating shared context from the start. Not just shared dashboards, but shared understanding, delivered as a single, intelligent alert with everything you need to know: the sequence of events, the causal chain, the impact, and the context.
So when something breaks, you’re not scrambling to assemble the right people and the right tools. You’re not burning the first chunk of your incident response window just trying to agree on what you’re looking at.
You’re acting on intelligence that’s already synthesized, correlated, and contextualized. This is not an incremental improvement. Selector is removing a tax you’ve been paying for so long you forgot that it didn’t have to be inevitable.
Here’s the Real Question
Next time something breaks, ask yourself: Do you really need a war room?
Or do you just need a system that understands what happened and tells you clearly?
If you’re still spending the first twenty minutes of every incident just trying to agree on what you’re looking at, you don’t have an incident problem. You have a fragmentation problem.
And it’s fixable.
Stay Connected
Selector is helping organizations move beyond legacy complexity toward clarity, intelligence, and control. Stay ahead of what’s next in observability and AI for network operations:
- Subscribe to our newsletter for the latest insights, product updates, and industry perspectives.
- Follow us on YouTube for demos, expert discussions, and event recaps.
- Connect with us on LinkedIn for thought leadership and community updates.
- Join the conversation on X for real-time commentary and product news.


