Network operations have become increasingly complex due to the distributed nature of modern applications which use data from private data centers, public clouds and the internet to provide end user services. With the adoption of these multi-cloud, multi-tier application architectures, network engineers must integrate new services (e.g AWS Direct Connect and Kubernetes clusters) from cloud providers into their existing services. To make operations more challenging, operational and data access methods of different network services are quite different. For example, cloud providers only provide an API (e.g Cloudwatch) to get operational metrics, while traditional networking equipment provides SNMP, streaming telemetry and Netconf interfaces. As a result, introducing new network services and MOPs is expensive as they can disrupt networks carrying revenue generating traffic.
Introducing Selector’s Network Digital Twin (NDT), a digital representation of your network created from real time data. This service enables efficient decision-making and experimentation without interfering with the real network, reducing risks to your infrastructure. The NDT gathers all network metrics, logs and events in real-time and draws correlations using ML. Unlike legacy solutions which use “simulation software”, the NDT relies on real time operational metrics and logs. It visualizes and analyzes the present network state, learns from the past, and fast-forwards to predict future scenarios.
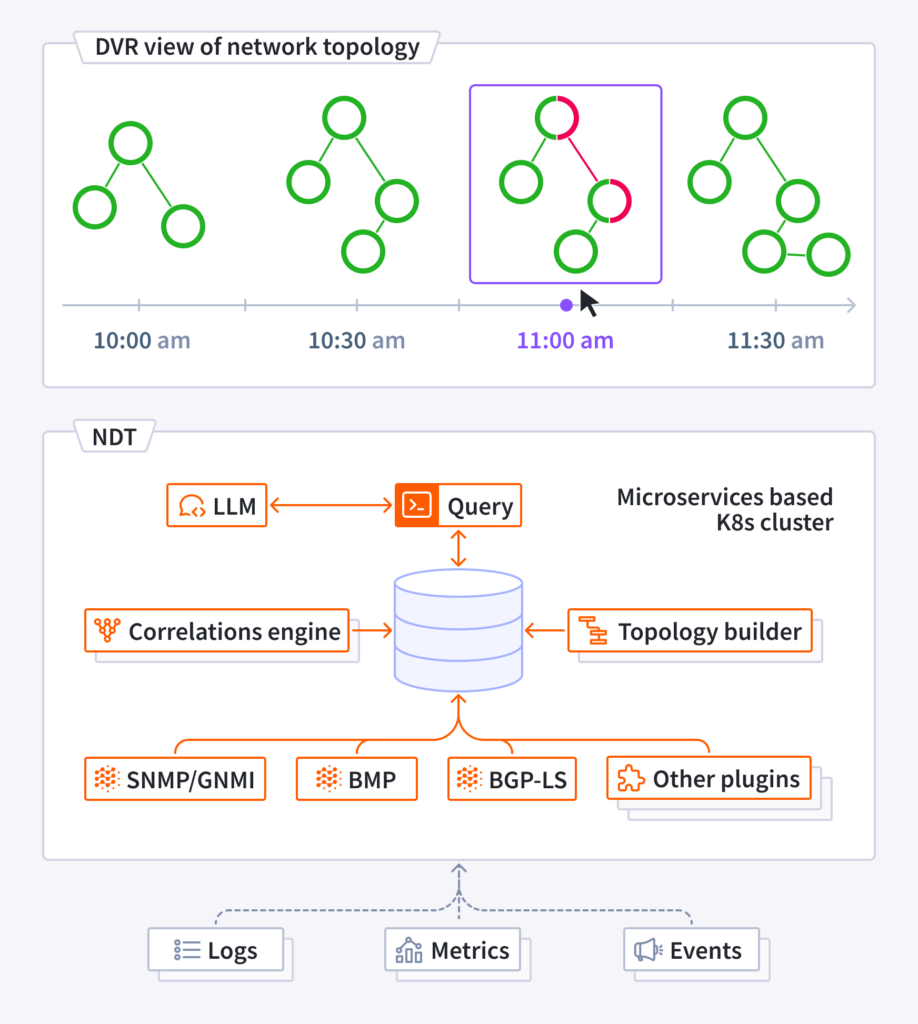
Real Time view of the network: NDT offers a real-time view of the network and services topologies. It shows the quality of different paths, including end-to-end latency, any packet drops along the path, and queue build-ups. This information allows for faster troubleshooting and increased resilience by pinpointing the exact moment an issue occurs and tracing its effects across the network. The paths are learnt by a variety of mechanisms such as real time BGP LS streams, RIBs via BMP, and LLDP polling via SNMP.
Network DVR: NDT records all historical data depending on the retention policies configured on the platform. This ability is used to playback past events to diagnose root causes of the issue. Outages or chronic issues are caused by slow buildup of bad events; for example, slight topology changes cause increases in the number of hops in a path, thus increasing latencies. The NDT addresses issues by detecting the latency increases using ML, then DVRing in the past to show when the topology changed, and highlighting the configuration change that may have mistakenly increased the costing of a link, causing the path change.
What-If analysis: Using the experimentation platform of the NDT, customers can stress-test network resiliency against link/optical faults, device failures, or impact of excess traffic from a potential DDoS attack. Users can identify the sites that are prone to blackouts by simulating link/node failures. For example simulation scenarios can be created where the number of prefixes advertised by a route reflector are increased. Then one can observe whether any circuit breakers that limit prefix advertisements get tripped. This feature allows network operators to determine potential choke points in the network and address them proactively.
Growth Planning and Cost Optimization: NDT allows customers to identify and resolve network bottlenecks and repurpose underutilized resources. Customers can model different growth scenarios as new users or new services come aboard the network. This type of scenario planning helps customers to manage their CapEx and OpEx budgets and run a profitable network. By using ML based predictive algorithms, the NDT can proactively inform operators that the number of 10G ports in a given network location should be increased as there is likely to be an increase in user demand in that location.
Summary: Selector’s network digital twin transforms how you operate your network. The NDT is the DVR of networking: by looking into the past, it helps you make decisions for the future. The experimentation platform allows you to test new services and network configurations without putting your existing networks at risk. Ready to see your network in a new light? Contact Selector today to learn more about our digital twin solution.