AI for Network Leaders — Powered by Selector

Join us in NYC on March 25th

AI for Network Leaders — Powered by Selector

Join us in NYC on March 25th

On this page

Log Message Extraction Without Regular Expressions

Network operation engineers must deal with log messages generated by multiple devices and technologies. Log message extraction is crucial because these messages carry valuable information, but their unstructured design makes it challenging to automate the process.

The standard procedure used so far is based on regular expressions (Regex or Grok or similar) that are used to find and extract the fields of interest. This has always been an arduous process for several reasons.

  1. Building those expressions can be complex.
  2. They need to be supported and evolved over time.
  3. Engineers who created them may not leave proper documentation, resulting in reverse-engineering efforts.
  4. Vendors may change the format for their syslog messages, breaking existing regular expressions and blocking log message extraction.

Moving Beyond Manual Log Message Extraction

The era of “human-based rules” to extract information has passed. We have evolved into a digital transformation of how data and algorithms are processed.

With data and algorithms, we can accomplish many of the tasks that previously required manually configured rules. This shift is transforming log message extraction for network operations teams.

NLP-Powered Log Message Extraction with Selector

Selector’s platform uses state-of-the-art Natural Language Processing (NLP) techniques to manage log messages and simplify log message extraction. Now, we are also using NLP techniques to identify and extract key information from within a log.

Named Entity Recognition (NEW) for Smarter Extraction

Named Entity Recognition (NER) is a well-known technique in the context of Natural Language Processing that allows the automatic extraction of key and relevant information from text.

In this case, the target text is a log message, and the relevant information can include:

  • Hostnames
  • IP addresses
  • MAC addresses
  • Fully qualified domain names
  • Interface names

Selector’s Named Entity Recognition will train a model using the customer’s key sources of data, such as inventories, customer databases, and other relevant data. With that, Selector’s Log processing pipeline automatically performs log message extraction and enriches log messages with the new fields automatically identified by the NER algorithm.

From Enriched Logs to Actionable Insights

Once logs are enriched with the new labels, key analytics and insights can be generated so that the Selector Platform can surface multidimensional anomalies that are otherwise very difficult to identify.

Chasing fields with regular expressions is not an effective use of time. Advanced techniques like NLP and NER automate this process and allow network operation engineers to focus on anomalies and proactive management, not manual log parsing.

Key Benefits for Network Operations Teams

Selector’s Analytics platform offers several key benefits:

  1. No more complex regex maintenance – Operations teams are no longer required to create and maintain complex and numerous regular expressions to parse and extract data from logs.
  2. Automatic anomaly detection – By extracting key fields and performing multidimensional anomaly detection, Selector surfaces unseen anomalies from logs.
  3. Faster problem identification – Network operation engineers can quickly identify issues that might otherwise remain hidden.
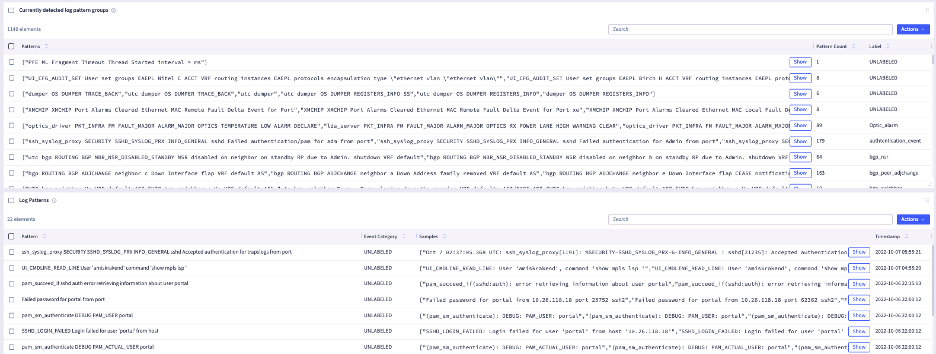
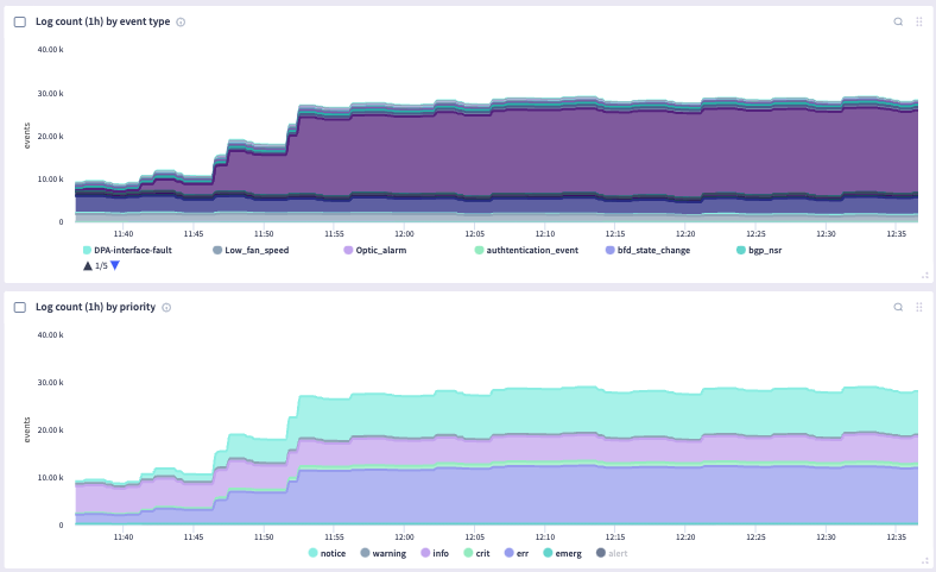
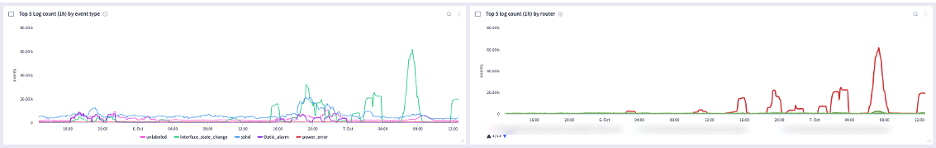
See It in Action

Below are several screenshots of this unique feature:

Interested in learning more about this feature? Contact us today for a free demo!

More on our blog

Beyond the Dashboard: Selector’s Patented Approach to Conversational Observability

For years, IT operations teams have been trapped in a frustrating paradox: the data they need to solve critical issues is right at their fingertips, yet entirely out of reach. Accessing it requires engineers to master complex, platform-specific query languages, dig through endless layers of dashboards, and hunt for the exact visualization that holds the answer. Under the intense pressures of modern speed, scale, and complexity, this rigid model is breaking down. At Selector, we recognized a fundamental opportunity to change how teams interact with their data. Our recently published U.S. patent application (US20250278401A1, filed March 2, 2024, and published September 4, 2025), titled “Dashboard metadata as training data for natural language querying,” outlines a transformative solution. By utilizing dashboard metadata, aliases, and user interaction data as training material, we empower operators to bypass structured queries entirely and obtain infrastructure insights using plain, natu

The Business Case for AI-Driven Observability in Network Operations

Modern network operations generate an extraordinary amount of telemetry. Metrics, logs, events, topology data, cloud signals, and service context all contribute to a richer picture of system behavior. As environments expand across cloud, data center, edge, and SaaS, the opportunity for operations teams is clear: when that telemetry is unified and understood in context, it becomes a powerful source of resilience, efficiency, and business insight. That is why AI-driven observability has become such an important priority for IT and operations leaders. Its value comes from helping teams move through complex environments with greater clarity. Correlated signals, contextual awareness, and shared operational understanding help teams identify issues faster, coordinate more effectively, and resolve incidents with greater confidence. For business leaders, the conversation is increasingly practical. They want to understand how observability investments contribute to uptime, team productivity, op

Solving the Ticket Noise Problem: What We Learned from Our ServiceNow Webinar

On March 18th, we hosted a session focused on a challenge that continues to undermine even the most mature IT operations teams: ticket noise.  It’s easy to dismiss noise as just “too many alerts”. But as we explored in the webinar, the real issue runs deeper. Ticket noise is a symptom of something more fundamental — a lack of correlation, context, and shared visibility across the stack.  If you weren’t able to attend, this blog walks through the key ideas, examples, and takeaways. And if any of this feels familiar, it’s worth watching the full session.  View “Solving the Ticket Noise Problem: Bringing Intelligence to ServiceNow”.  The Hidden Cost of Tickets Most organizations don’t struggle because they lack monitoring. In fact, the opposite is true — they have too much of it. Over time, teams adopt specialized tools for every layer of the environment: Each tool does its job well within its domain, but incidents don’t respect those boundaries. As discusse

このサイトは開発サイトとして wpml.org に登録されています。remove this banner のキーを使用して本番サイトへ切り替えてください。