In modern IT environments, data is abundant, but clarity is rare. Enterprises deploy dozens of monitoring tools to collect metrics, events, and logs from across the network, yet when something goes wrong, teams still scramble to connect the dots. Why? Because these data streams exist in siloes, isolated by format, source, or system.
In the first blog in this series, we explored how Selector’s Data Hypervisor tackles that problem head-on – normalizing and enriching raw telemetry into a unified, context-rich data layer. It’s the essential first step in enabling AI-powered operations.
But harmonized data alone doesn’t solve the problem. To truly understand what’s happening in a dynamic, multi-domain network, you need to go one step further: correlation.
Each tool offers a limited view, forcing operators to conduct time-consuming investigations, switch between dashboards, review log entries, and chase alerts that may or may not be connected. The result? Slow resolution times, alert fatigue, and increased operational risk.
To truly unlock the promise of AIOps, we must go beyond data collection and into data correlation—the process of transforming fragmented telemetry into meaningful, actionable context.
The Problem with Isolated Alerts
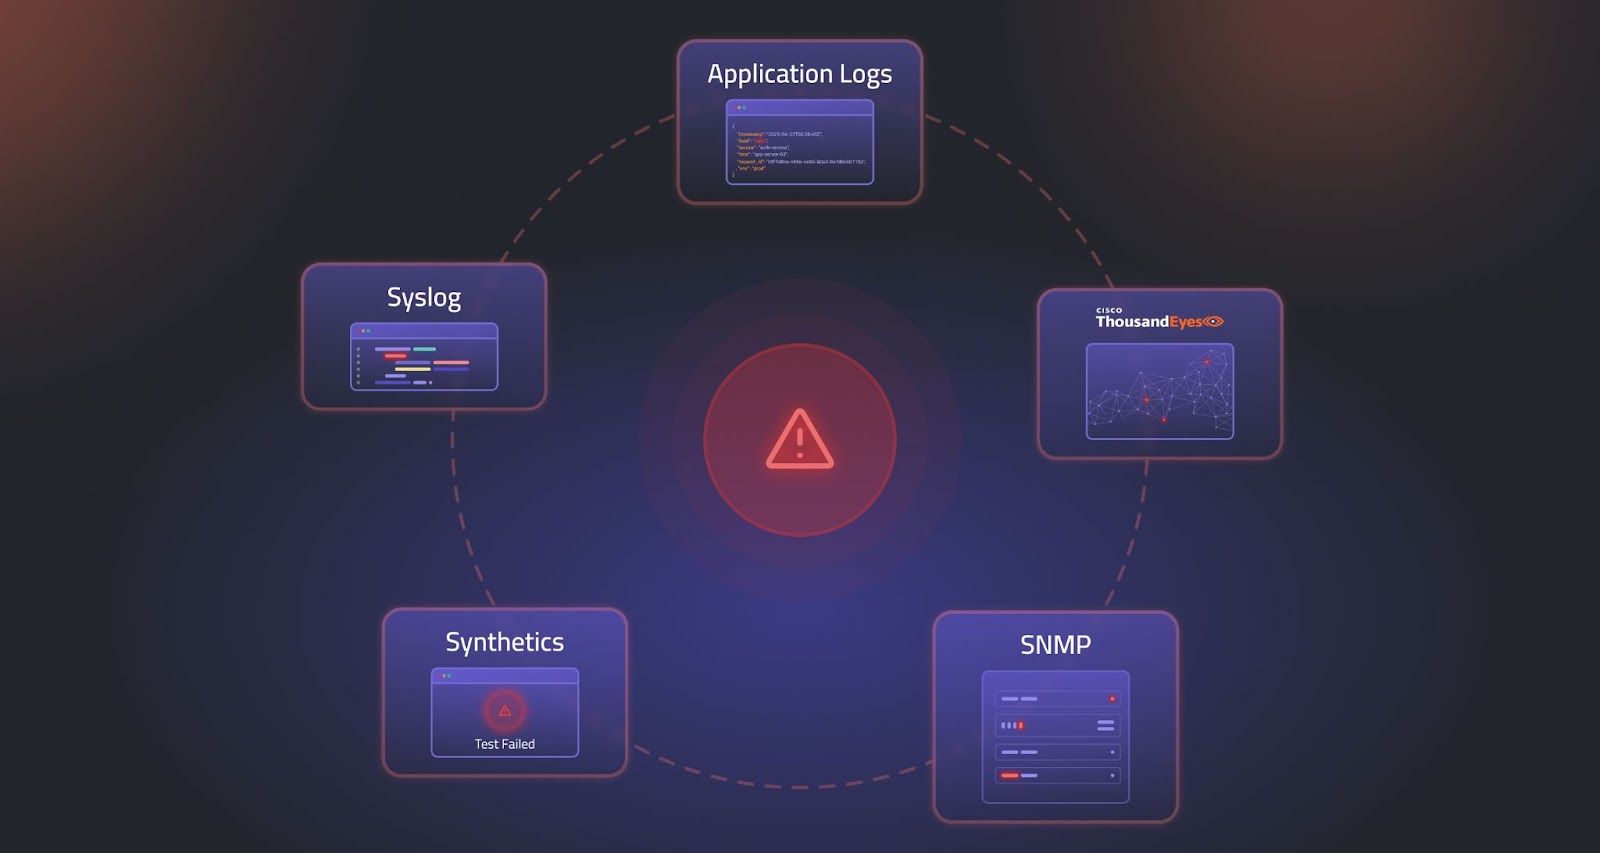
In a typical NOC scenario, a sudden service degradation can trigger dozens of independent alerts: one from a switch reporting high interface errors, log messages indicating that routing adjacencies have changed, another from synthetics noting a drop in performance, and additional alarms from adjacent devices. Each signal tells a piece of the story, but without context, operators are left guessing which is the root cause and which are symptoms.
This is the cost of disconnected data. Legacy systems treat metrics, synthetics, logs, and events as standalone entities. They miss the relationships across time, topology, and service layers that define what’s happening. As networks become more complex and distributed, this lack of correlation worsens.
From Signals to Story: How Selector Connects the Dots
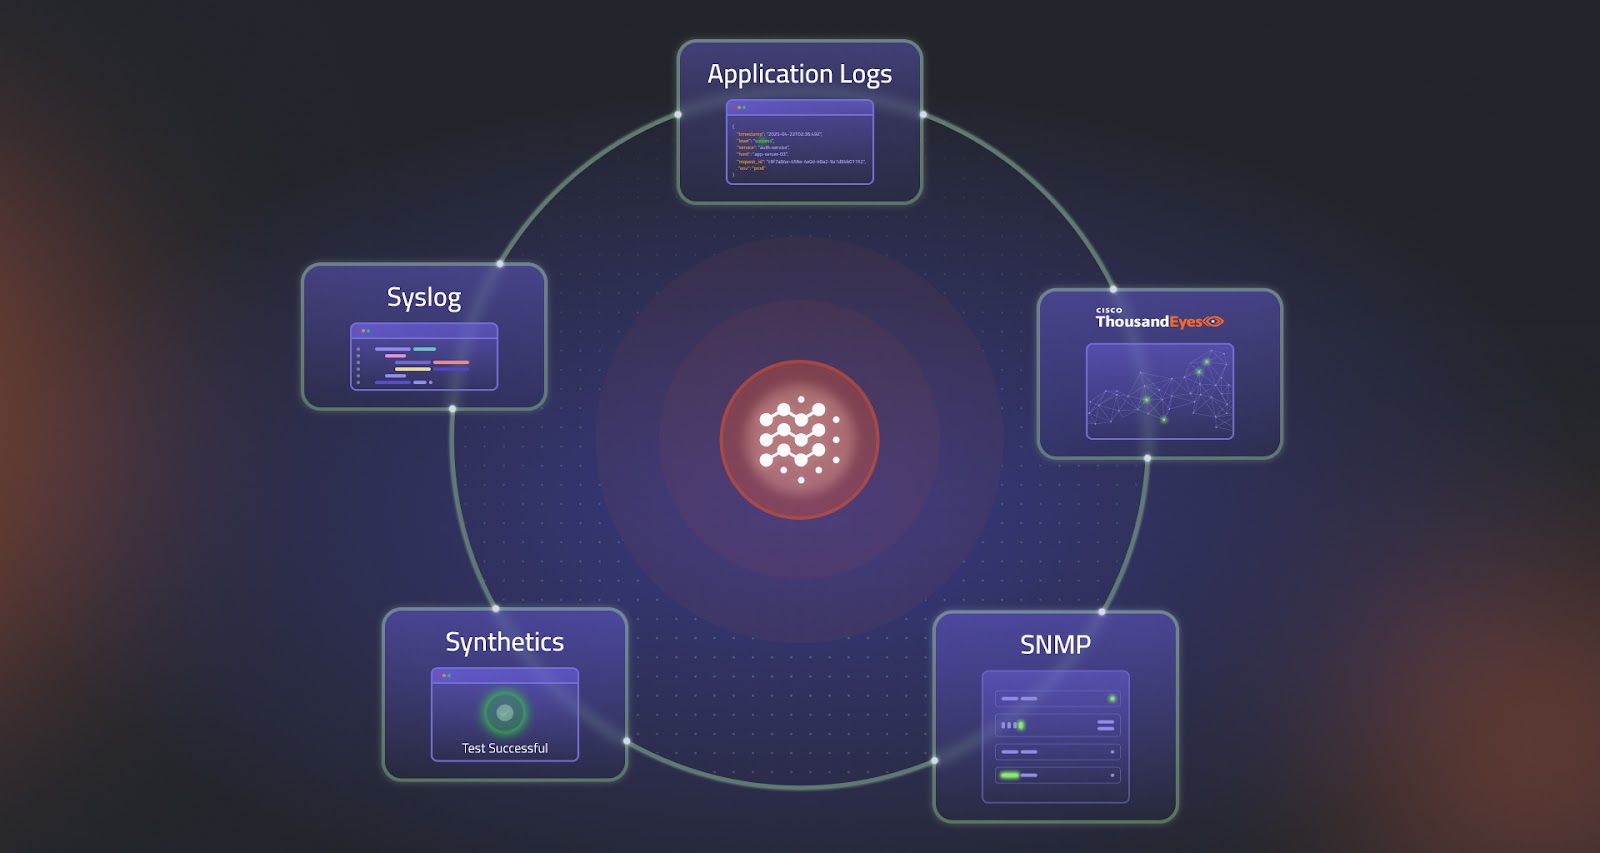
Selector transforms this broken workflow by delivering real-time, cross-domain correlation through the use of AI and machine learning. It doesn’t just collect telemetry. It understands it.
At the heart of this capability is Selector’s Knowledge Service, which ingests enriched telemetry from the Data Hypervisor and uses a combination of recommender models and association models to uncover hidden relationships. By correlating across time series data, logs, alerts, and events, Selector tells a coherent story about what happened, when it happened, and why.
Whether the source is SNMP, syslog, ThousandEyes, vManage, or another telemetry stream, Selector doesn’t treat them as isolated channels. It normalizes and enriches the data, aligns it by timestamp and topology, and uses ML models to group related anomalies into a single, actionable insight.
The Power of S2QL and ML-Driven Correlation
Selector’s engine is powered by the Selector Software Query Language (S2QL), a purpose-built query language that enables deep correlation across diverse data types. Combined with machine learning models trained to identify patterns, clusters, and outliers, Selector rapidly detects both known and novel issues.
- Recommender models identify events that frequently co-occur across similar contexts, such as high interface errors followed by packet drops.
- Association models detect causal relationships between events and performance degradations.
- Correlation can be both temporal (occurring at the same time) and contextual (occurring across logically or physically related network elements).
The result is faster MTTI, MTTD, and MTTR – because operators don’t have to waste time digging through layers of alerts to find what matters. They’re given the root cause upfront, with all supporting evidence attached.
Explainable AI: Trust Built In
While automation and AI are powerful, they must also be transparent and accountable. Selector builds human-in-the-loop explainability into every step. Each insight is accompanied by a clear rationale, traceable data sources, and the ability to drill down into contributing metrics, events, or logs.
Not only can operators trust the result, but they can also understand how it was reached. This creates confidence in the system’s recommendations, accelerates adoption, and reduces resistance to AI-powered workflows.
Real-World Impact – Without the Wait
Unlike legacy platforms that require months of customization, training, or expensive GPU infrastructure, Selector delivers value in days. Its plug-and-play integrations and low-code configuration make it fast to deploy, even in large, complex environments.
And because the platform is built on Kubernetes and supports SaaS and on-prem deployments, it can scale up or down depending on your organization’s needs with no disruption to existing workflows.
Correlation is the Bridge to AI-Driven Automation
Correlation isn’t just about better alerts. It’s the gateway to autonomous operations. When systems can understand the full context of an issue, they can begin to anticipate failures, recommend remediations, or even trigger automated workflows through integrations like Itential, ServiceNow, or PagerDuty.
Selector’s architecture is built for this future. The same models that correlate anomalies today will drive predictive alerts, capacity forecasting, and self-healing actions tomorrow.
If your team is drowning in alerts but starving for answers, it’s time to shift from fragmented signals to unified stories. Selector enables context-aware correlation that’s fast, explainable, and designed for modern network complexity.
Schedule a demo to see how Selector can help your team move from noise to knowledge, and follow us on LinkedIn or X to be notified of the next blog in “The Path to AI-Powered Network Operations” where we will explore how Selector leverages LLMs and AI Agents to unlock the next level of intelligent automation.