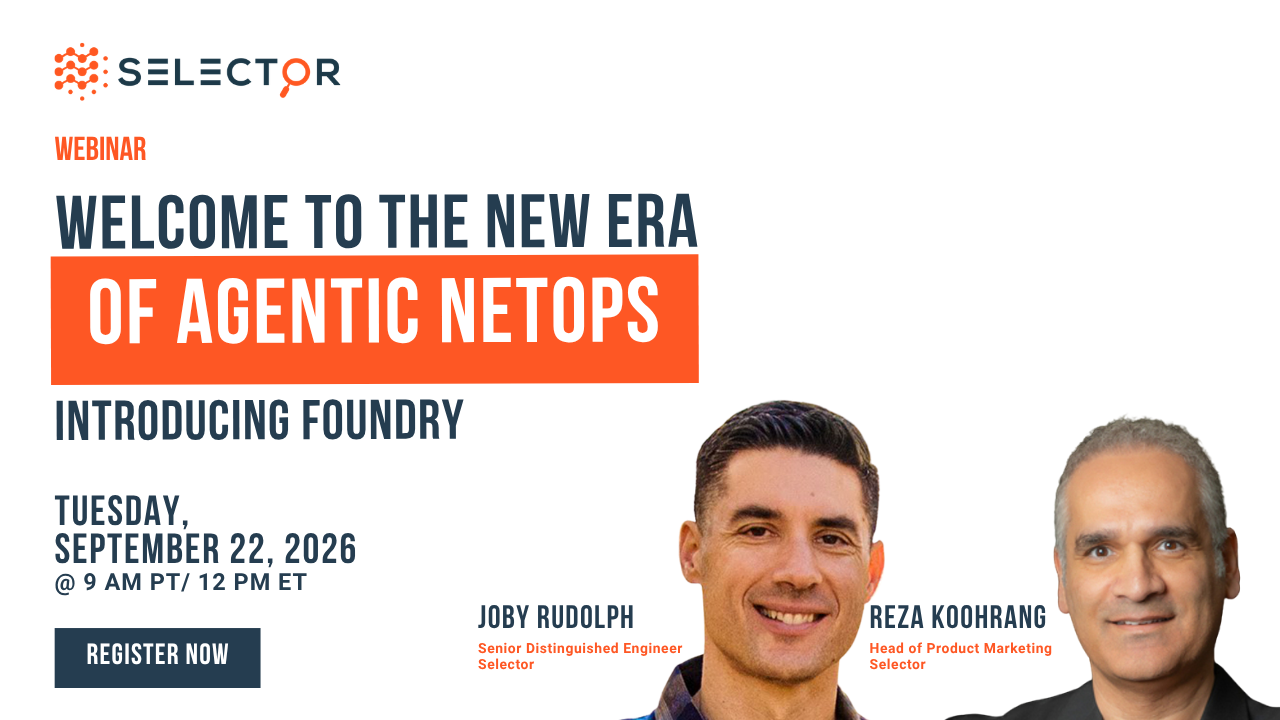
Webinar: The New Era of Agentic NetOps
Introducing Selector Foundry — Sept. 22
Webinar: The New Era of Agentic NetOps
Introducing Selector Foundry — Sept. 22

Product demo: in the Rosetta chat window, the prompt “edge-rtr-01 in Denver looks unhealthy. Investigate the impact, build me a view, and open a ticket for whoever owns it.” is typed in and sent. Rosetta dispatches four specialists in parallel — Loom, Artist, TicketMaster and Herald — and each reports done. Loom then expands with its evidence timeline and correlation figures, and Rosetta answers: a config push on edge-rtr-01 is destabilizing the Denver edge, with the actions taken and a recommended fix to roll back the 02:47 config push.
The difference isn’t just a better answer, but everything Rosetta understands, coordinates, and preserves before the answer appears: the context it reasons over, the specialists it calls, and the case it keeps open.
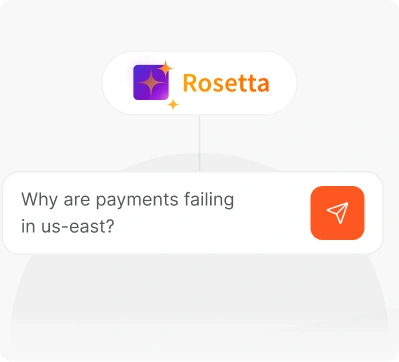
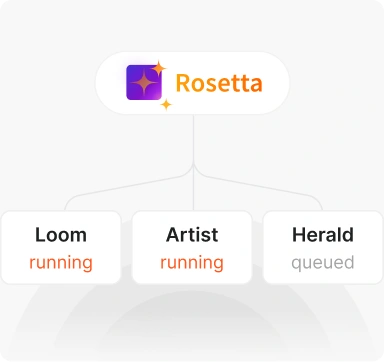
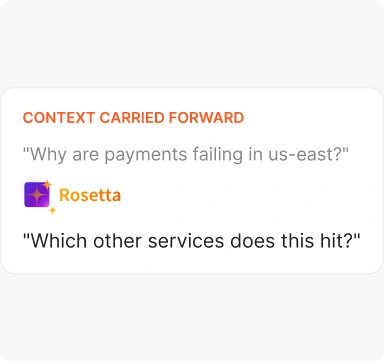
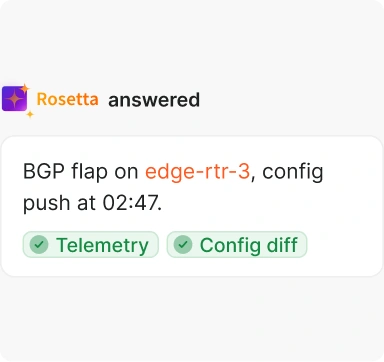
Selector's proprietary AIOps platform normalizes every signal, connects the evidence, and establishes root cause. Rosetta reasons over that finished context, coordinates the specialists, and carries the case forward on one model of your whole path.

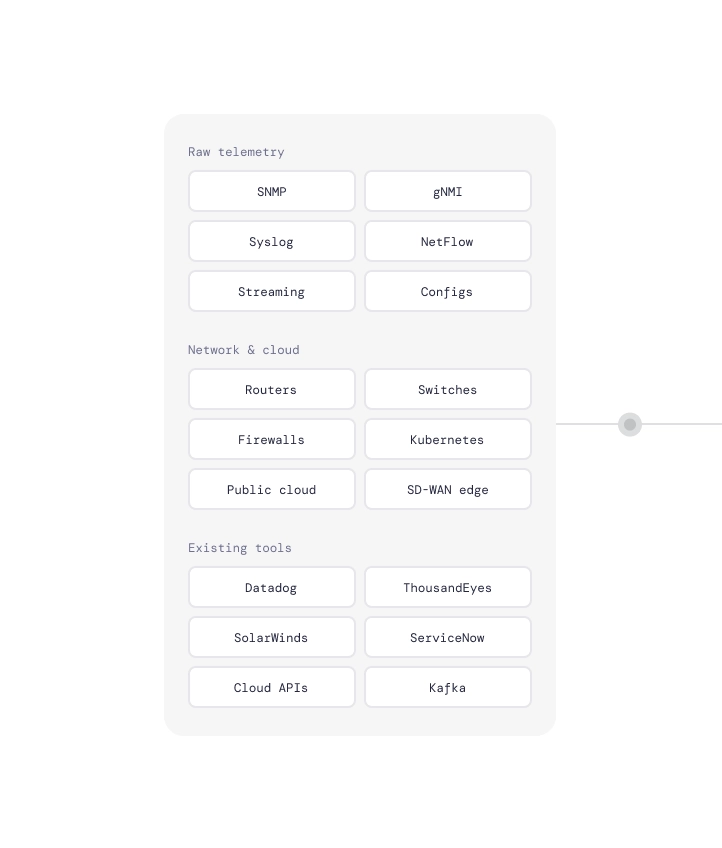
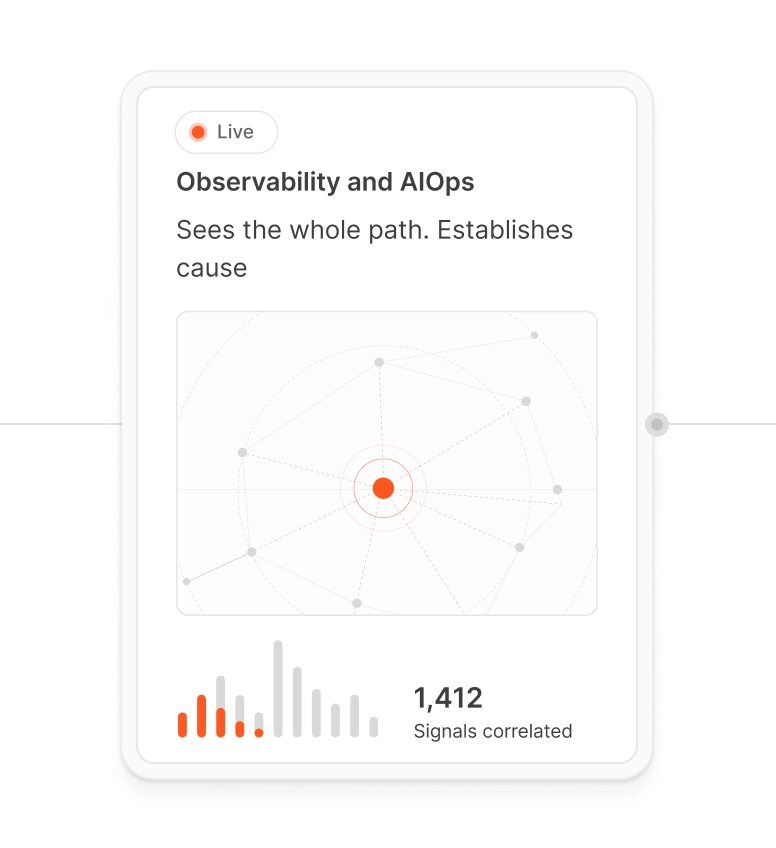

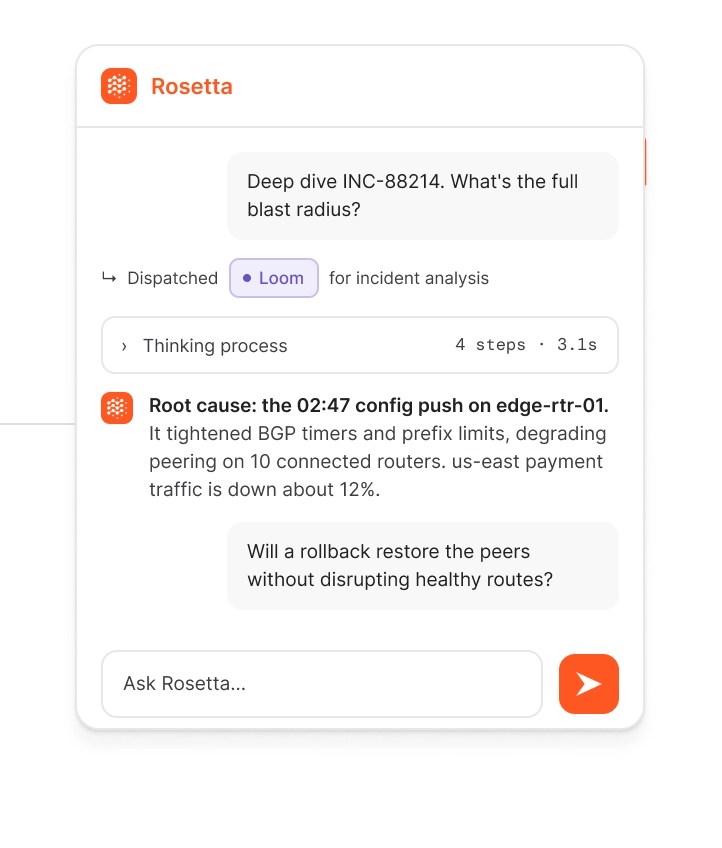
All you have to do is ask, and Rosetta runs the play with one connected thread, from question to verified answer, with the next step waiting on your approval
Product demo: the Rosetta window opens on “What’s on your mind?”. The prompt “Users at the São Paulo edge are seeing high latency. Investigate the impact, build me a live view, and open a ticket for the circuit owner.” is typed in and sent. Rosetta reads the request and breaks it into three tasks — investigate impact, build a live view, open a ticket — recognising edge-spo-01 in São Paulo on the WAN.
Users at the São Paulo edge are seeing high latency. Investigate the impact, build me a live view, and open a ticket for the circuit owner.
Product demo: Rosetta thinks through the approach in five steps — read intent, scope the path across edge-spo-01 and both WAN circuits, choose Loom, Artist, TicketMaster and Herald, retrieve 2,410 signals of context, and set guardrails so the investigation stays read-only. The plan is ready with 4 agents queued.
Product demo: Rosetta dispatches four specialists working in parallel. Loom correlates 6 signals across telemetry, config and topology and finds the root cause; Artist composes 6 widgets into a view; TicketMaster drafts the incident via ServiceNow over MCP; Herald prepares the page for the rack owners via Slack over MCP. Rosetta then correlates their findings across the path.
Correlating 6 signals across telemetry, config, topology.
Root cause foundComposing 6 widgets from your existing patterns.
Building viewDrafting the incident for the owner.
ServiceNow ⇄MCPPreparing the page for the rack owners.
Slack ⇄MCPProduct demo: Rosetta answers. Root cause: rising CRC errors on the primary MPLS circuit wan1 at São Paulo, with latency up 4 times and 12% of sessions degraded across two sites, detected in 5 minutes. Actions taken: investigated with Loom, built a view with Artist, opened ticket INC-51830 with TicketMaster, and paged owners with Herald. Recommended fix: shift traffic to the healthy backup path wan2 while the circuit is repaired — nothing runs until you approve.
Root cause: rising CRC errors on the primary MPLS circuit (wan1) at São Paulo. Latency is up 4x and 12% of sessions are degraded across two sites.
Recommended fix: shift traffic to the healthy backup path (wan2) while the circuit is repaired.
Selector agents run on your data, in your environment, on the LLM you choose. Yours to build, version, and govern.
Selector agents run on your data, in your environment, on the LLM you choose. Yours to build, version, and govern.
Grounded in evidence
Every answer starts from correlated evidence. Click any claim to see the telemetry or config diff behind it.
Your data, your model
Agents run where your data already lives, so nothing goes to an outside service. You choose the LLM.
Built and versioned by your team
Author agents, commit them to your Git, and test against past incidents before promotion. Runs under your RBAC.
Product demo: in the Rosetta chat window, “deep dive the incident in ashburn” runs the Incident Analyzer on S2INC-EQ-ASH1-EDGE01, a P2 incident on the Equinix Ashburn hub router EQ-ASH1-EDGE01. The analysis walks its evidence: the incident overview, the root cause — a configuration change under change ticket CHG0048271 titled “Optimize BGP convergence and add monitoring” — five specific configuration regressions, the blast radius across 10 branch border routers, and a revert plan. Rosetta then answers with the likely cause and the ten regional branch sites whose reachability it disrupted.
Read Gartners latest resport on Agentic NetOps Software to understand how the market is evolving, which capabilities matter most, and why Selector is recognized as a representative vendor in this emerging market.
Rosetta is the single gateway to everything the platform can do. You ask once, and it reasons with your LLM, delegates to the right agents, and reaches every function through MCP, then brings one answer back.
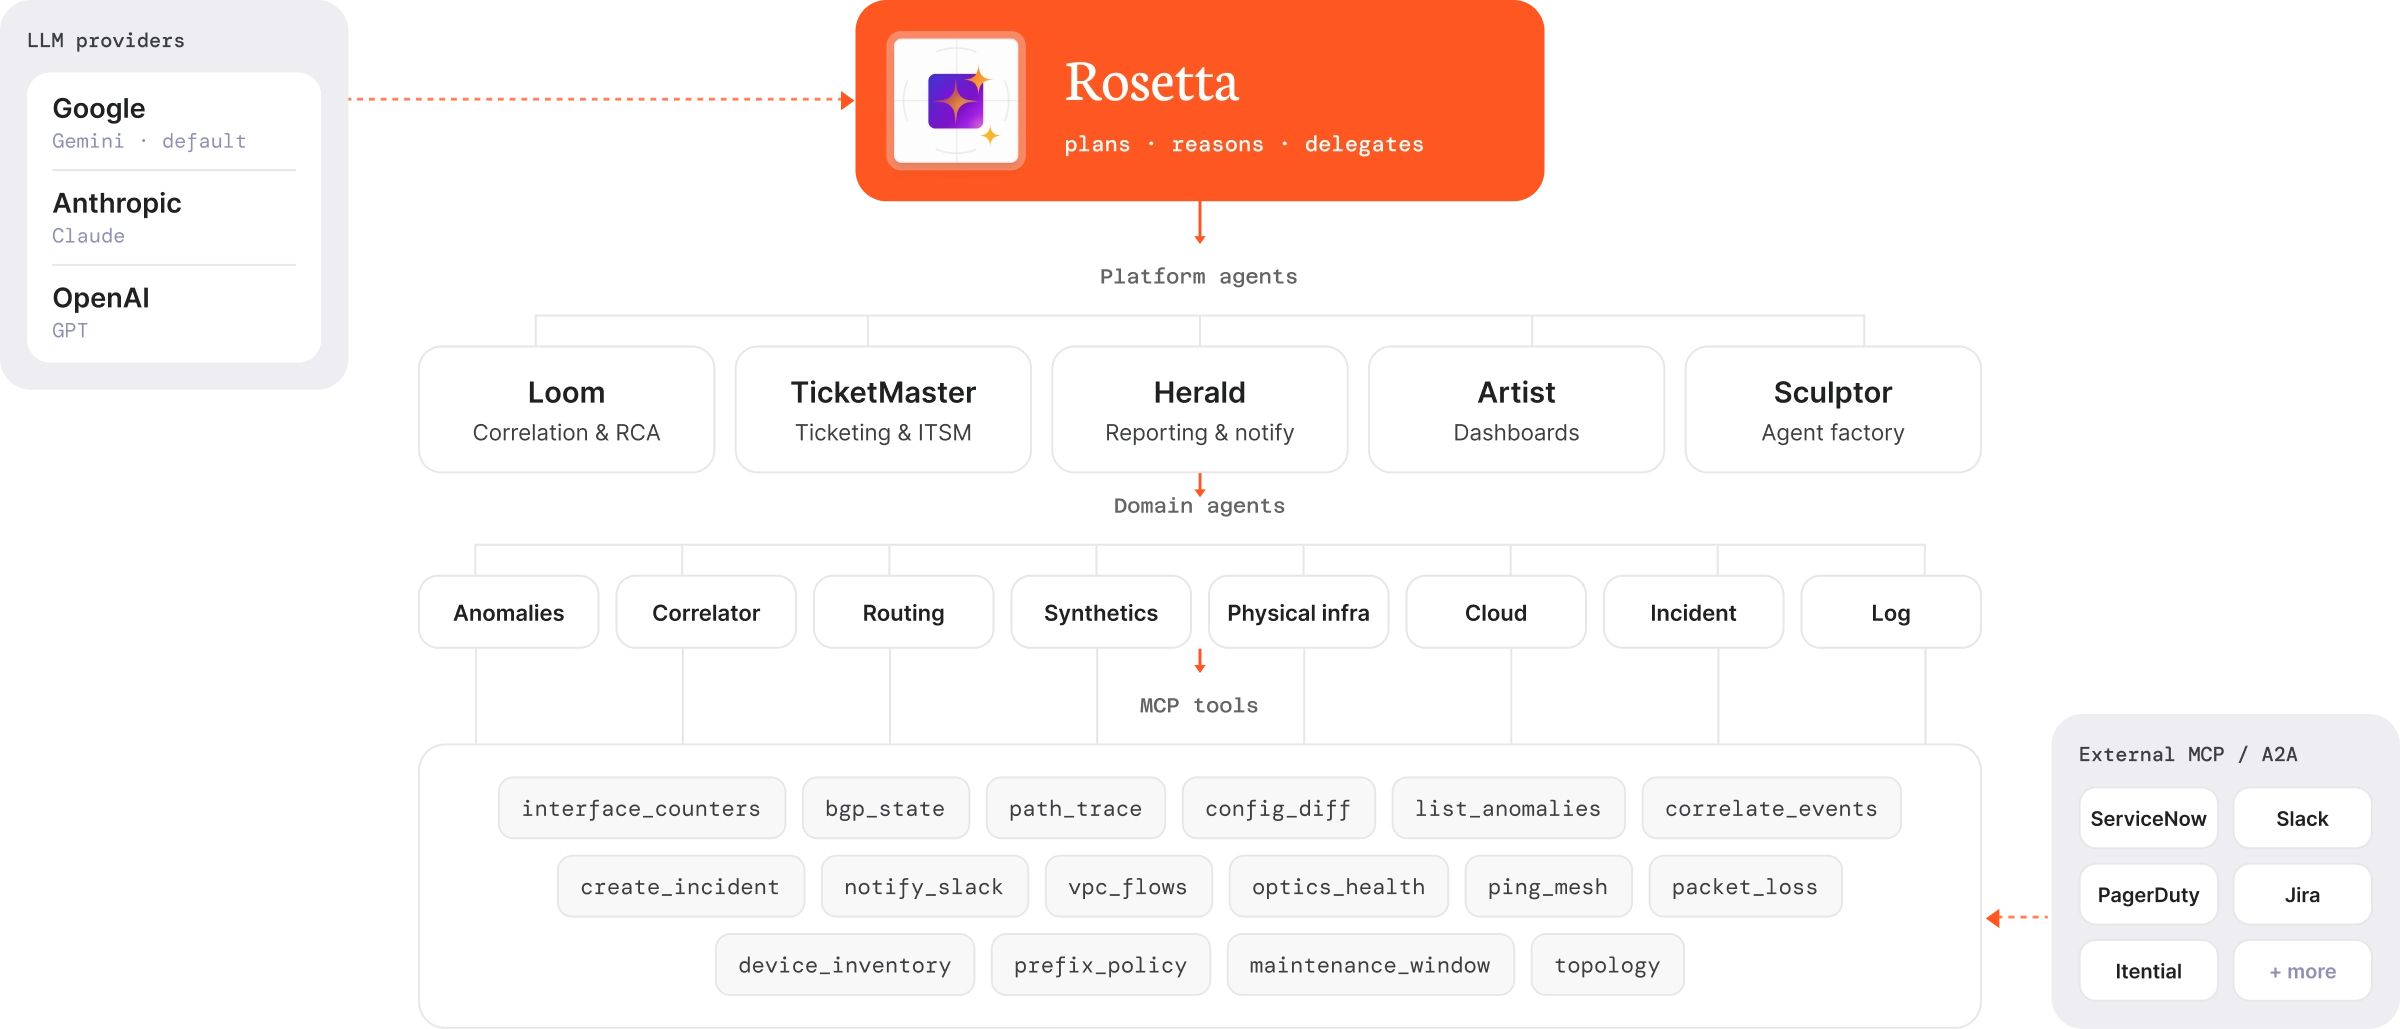
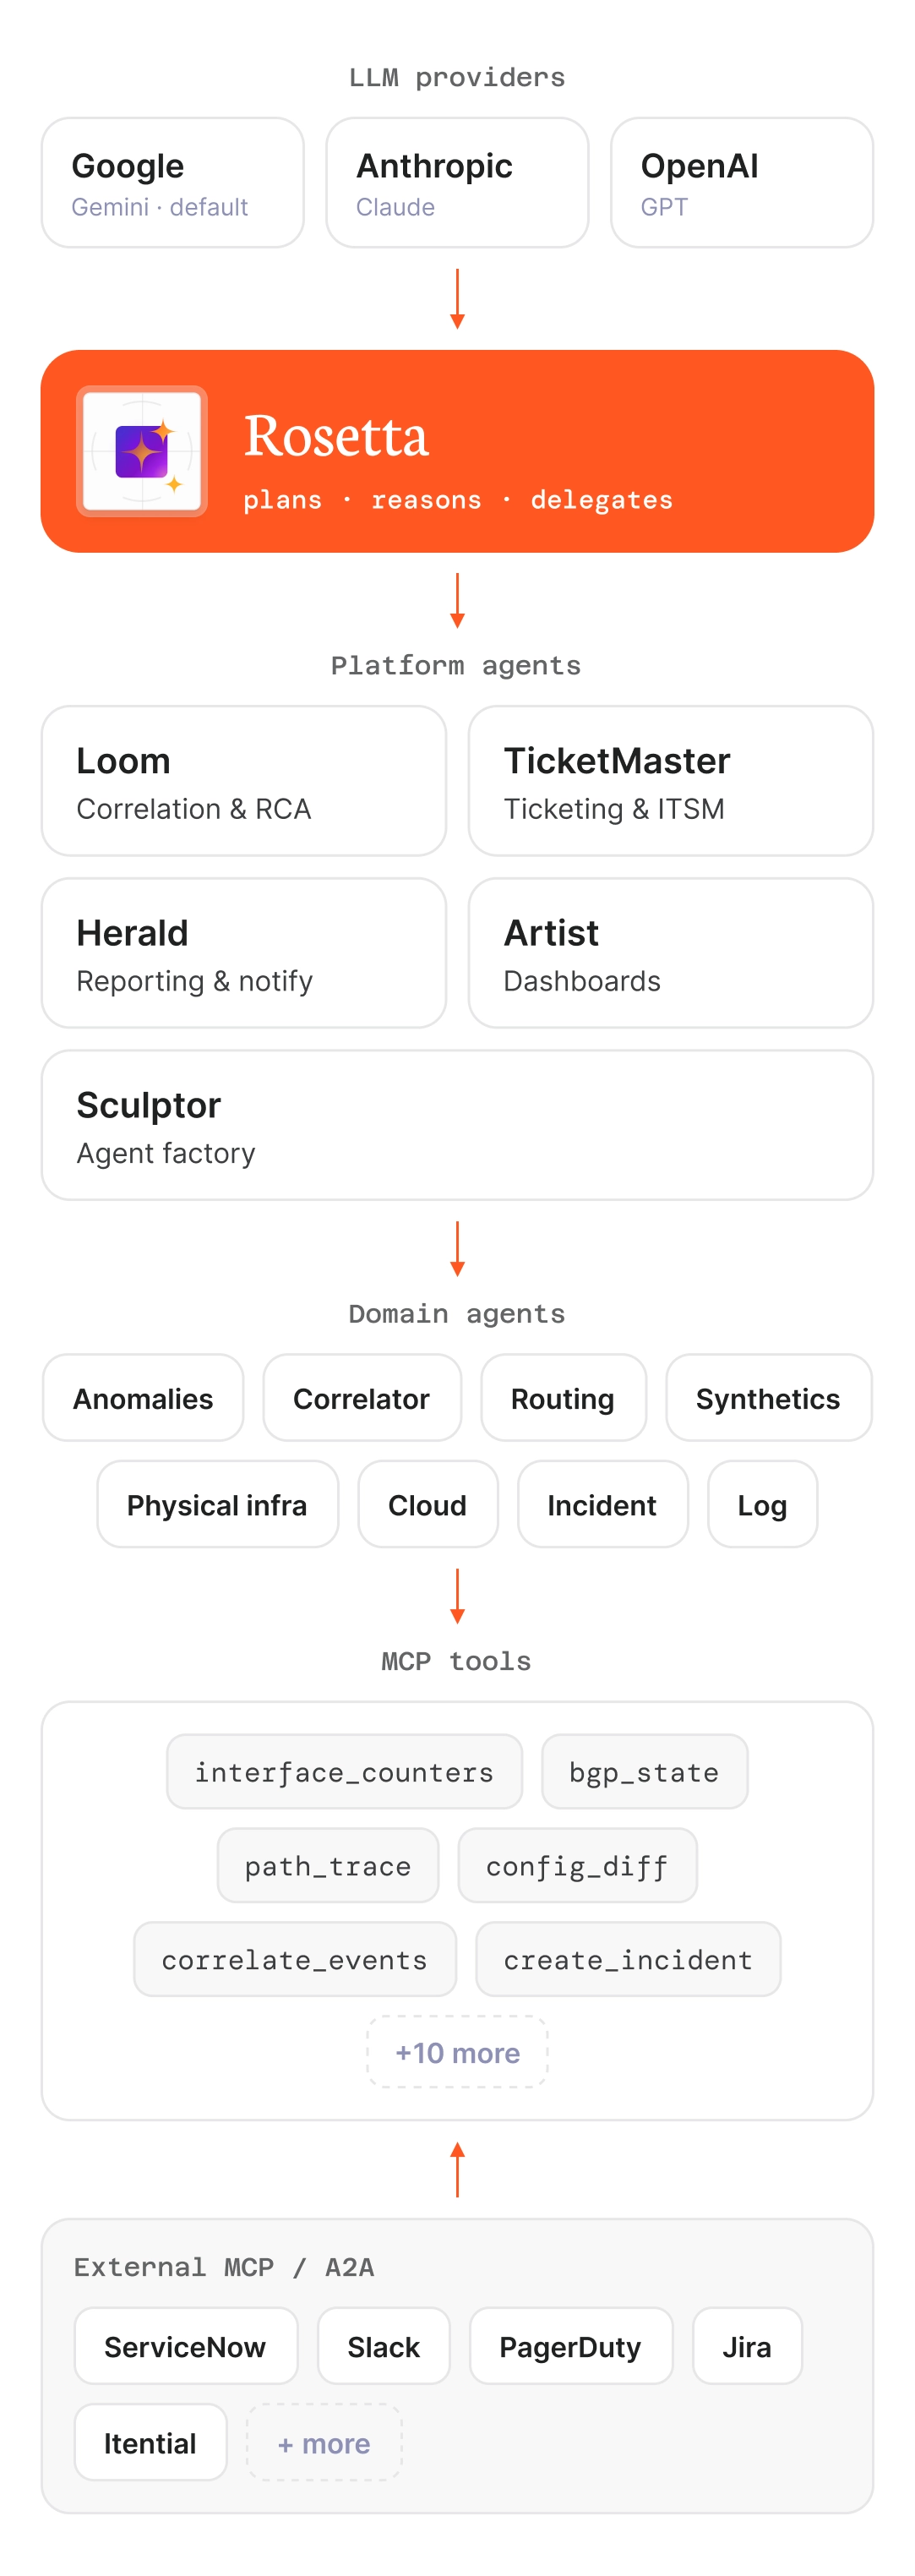
You only ever talk to Rosetta, the single way into every agent and function.
Rosetta hands your request down through platform agents, domain specialists, and MCP tools.
Rosetta is LLM-agnostic, planning and acting over your model of choice.
External tools and agents connect at the MCP layer, over standardized MCP and A2A protocols.
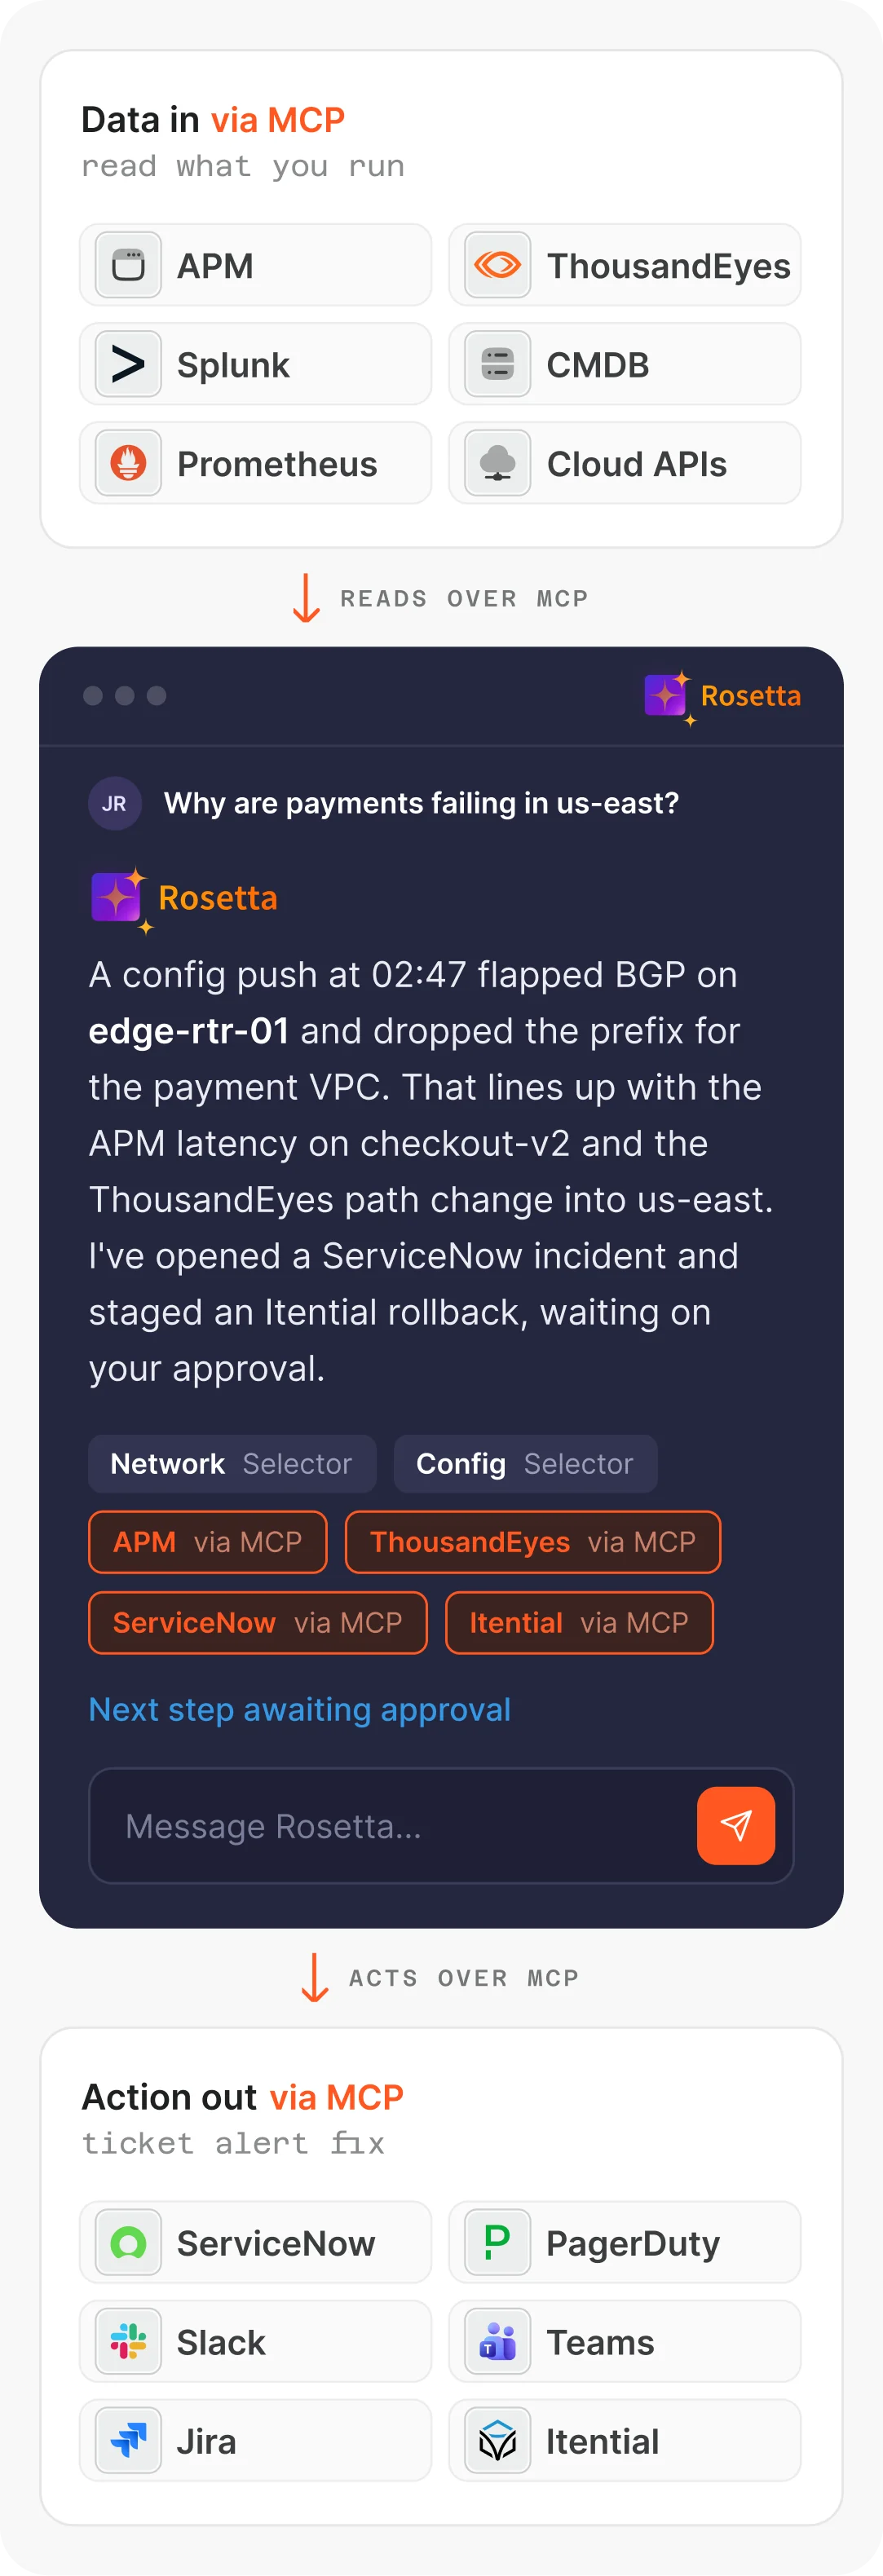
Rosetta reaches your own external tools over MCP. reading context from the systems you run, taking action in your ticketing, alerting, and automation tools, and correlating it all against Selector's own findings, in one interface.

Absolutely fantastic company. Their approach to intelligent network monitoring and analytics is unique and refreshing. I can’t recommend them highly enough. I honestly get excited by weekly catch-up calls because of the possibilities.
Principal Engineer, Comcast
Before Selector, we lacked the end-to-end visibility needed to see what was happening across our applications, infrastructure, and network. Now we have a consolidated view of all critical data sources allowing us to proactively detect and resolve issues faster to keep our services running and our customers happy.
VP of IT Operations, TracFone
Our goal is to keep service up – always. With Selector, we are constantly monitoring availability and performance. If an abnormal condition arises, we take immediate action.
Senior Manager of Infrastructure & Software Cloud Delivery, Bell
Selector is a next-generation tool which provides comprehensive visibility and automation capabilities to integrate with other platforms and products. This reduces the burden on our operations team, allowing us to improve incident and change management processes as well as detection and identification of network issues.
Digital Infrastructure Company
Selector has significantly enhanced the operations team workflow by improving alert visibility, correlating alerts, and assigning value to them. Also, the implementation of auto-incidents has been pivotal in reducing missed incidents and helping prioritize those that occur most frequently, enabling us to achieve faster response times.
Digital Infrastructure Company
Selector has provided our operations team with valuable insights and analytics. By analyzing vast amounts of data, Selector can identify patterns, anomalies, and trends, enabling operators to make data-driven decisions and optimize their activities. This has led to improved resource allocation, better capacity planning, and enhanced overall performance.
Digital Infrastructure Company
Selector has played a crucial role in automating and streamlining our operations. By leveraging advanced learning algorithms, Selector can proactively detect and resolve incidents, reducing downtime and minimizing the impact on operations. This has resulted in improved system availability and increased productivity.
Digital Infrastructure Company
Selector has revolutionized our operations and greatly enhanced the efficiency of our team. With the implementation of Selector, operators have experienced significant improvements across network monitoring and incident management.
Digital Infrastructure Company
As a next-generation observability tool, Selector AI is designed to work seamlessly across environments and industries, showcasing the transformative power of AI to elevate network resilience, minimize failures, and mitigate human error.
Digital Infrastructure Company
Selector provides proactive isolation event detection within the routing domain by correlating a range of packet loss metrics, automatically alerting the on-call engineer with precise location data and actionable insights to expedite troubleshooting. This intelligent approach has significantly reduced Mean Time to Repair (MTTR), enabling engineers to zero in on critical metrics that directly enhance customer experience.
Digital Infrastructure Company
Manual monitoring relies on engineers spotting alerts before raising incidents. If an engineer fails to notice an alert, there is a high chance the incident will be missed, along with the opportunity to troubleshoot and restore it promptly. Selector correlation ensures that no incidents are missed.
Digital Infrastructure Company
Selector has been a significant advancement in our network monitoring, marking a major milestone in automation. Prior to Selector, the incident KPI target was a challenge for our operations team. However, with Selector’s correlation capabilities, the time taken to address incidents has been significantly reduced compared to manual processes.
Digital Infrastructure Company

Every network engineer carries an instinct that outsiders mistake for caution: a change in one place can travel. Reroute a path, push a policy, drop an interface, and the effect