Webinar: A Day in the Life of an Agentic Network Operator
October 28th @ 9 AM PST / 12 PM EST
Webinar: A Day in the Life of an Agentic Network Operator
October 28th @ 9 AM PST / 12 PM EST


Selector lets you see beyond dashboards, connecting logs, traces, and telemetry into one view of cause and effect, so you can resolve faster, prove impact, and release confidently.

Correlate logs, traces, and configs across every deomain to isolate true root causes.

Understand where latency, loss, or API failures actually originate from in real time.

Detect anomalies, regressions, and failure patterns before they reach users.

Quantify uptime gains and operational efficiency across every release cycle.

Use live and historical telemetry to enhance performance, validate changes, and strengthen reliability.
Selector providers a unified view of application performance, infrastructure health, and user experience — connecting telemetry across every layer to reveal the full story behind issues and opportunities for improvement.
Correlate issues across code, services, and network layers to reveal true root cause.
Follow transactions through distributed systems to uncover bottlenecks and failure chains.
Automatically detect unusual behavior, latency spikes, or regressions in real time.
Combine simulated and live traffic to validate reliability and optimize experience.
Forecast risk and performance impact before new releases or configuration changes.
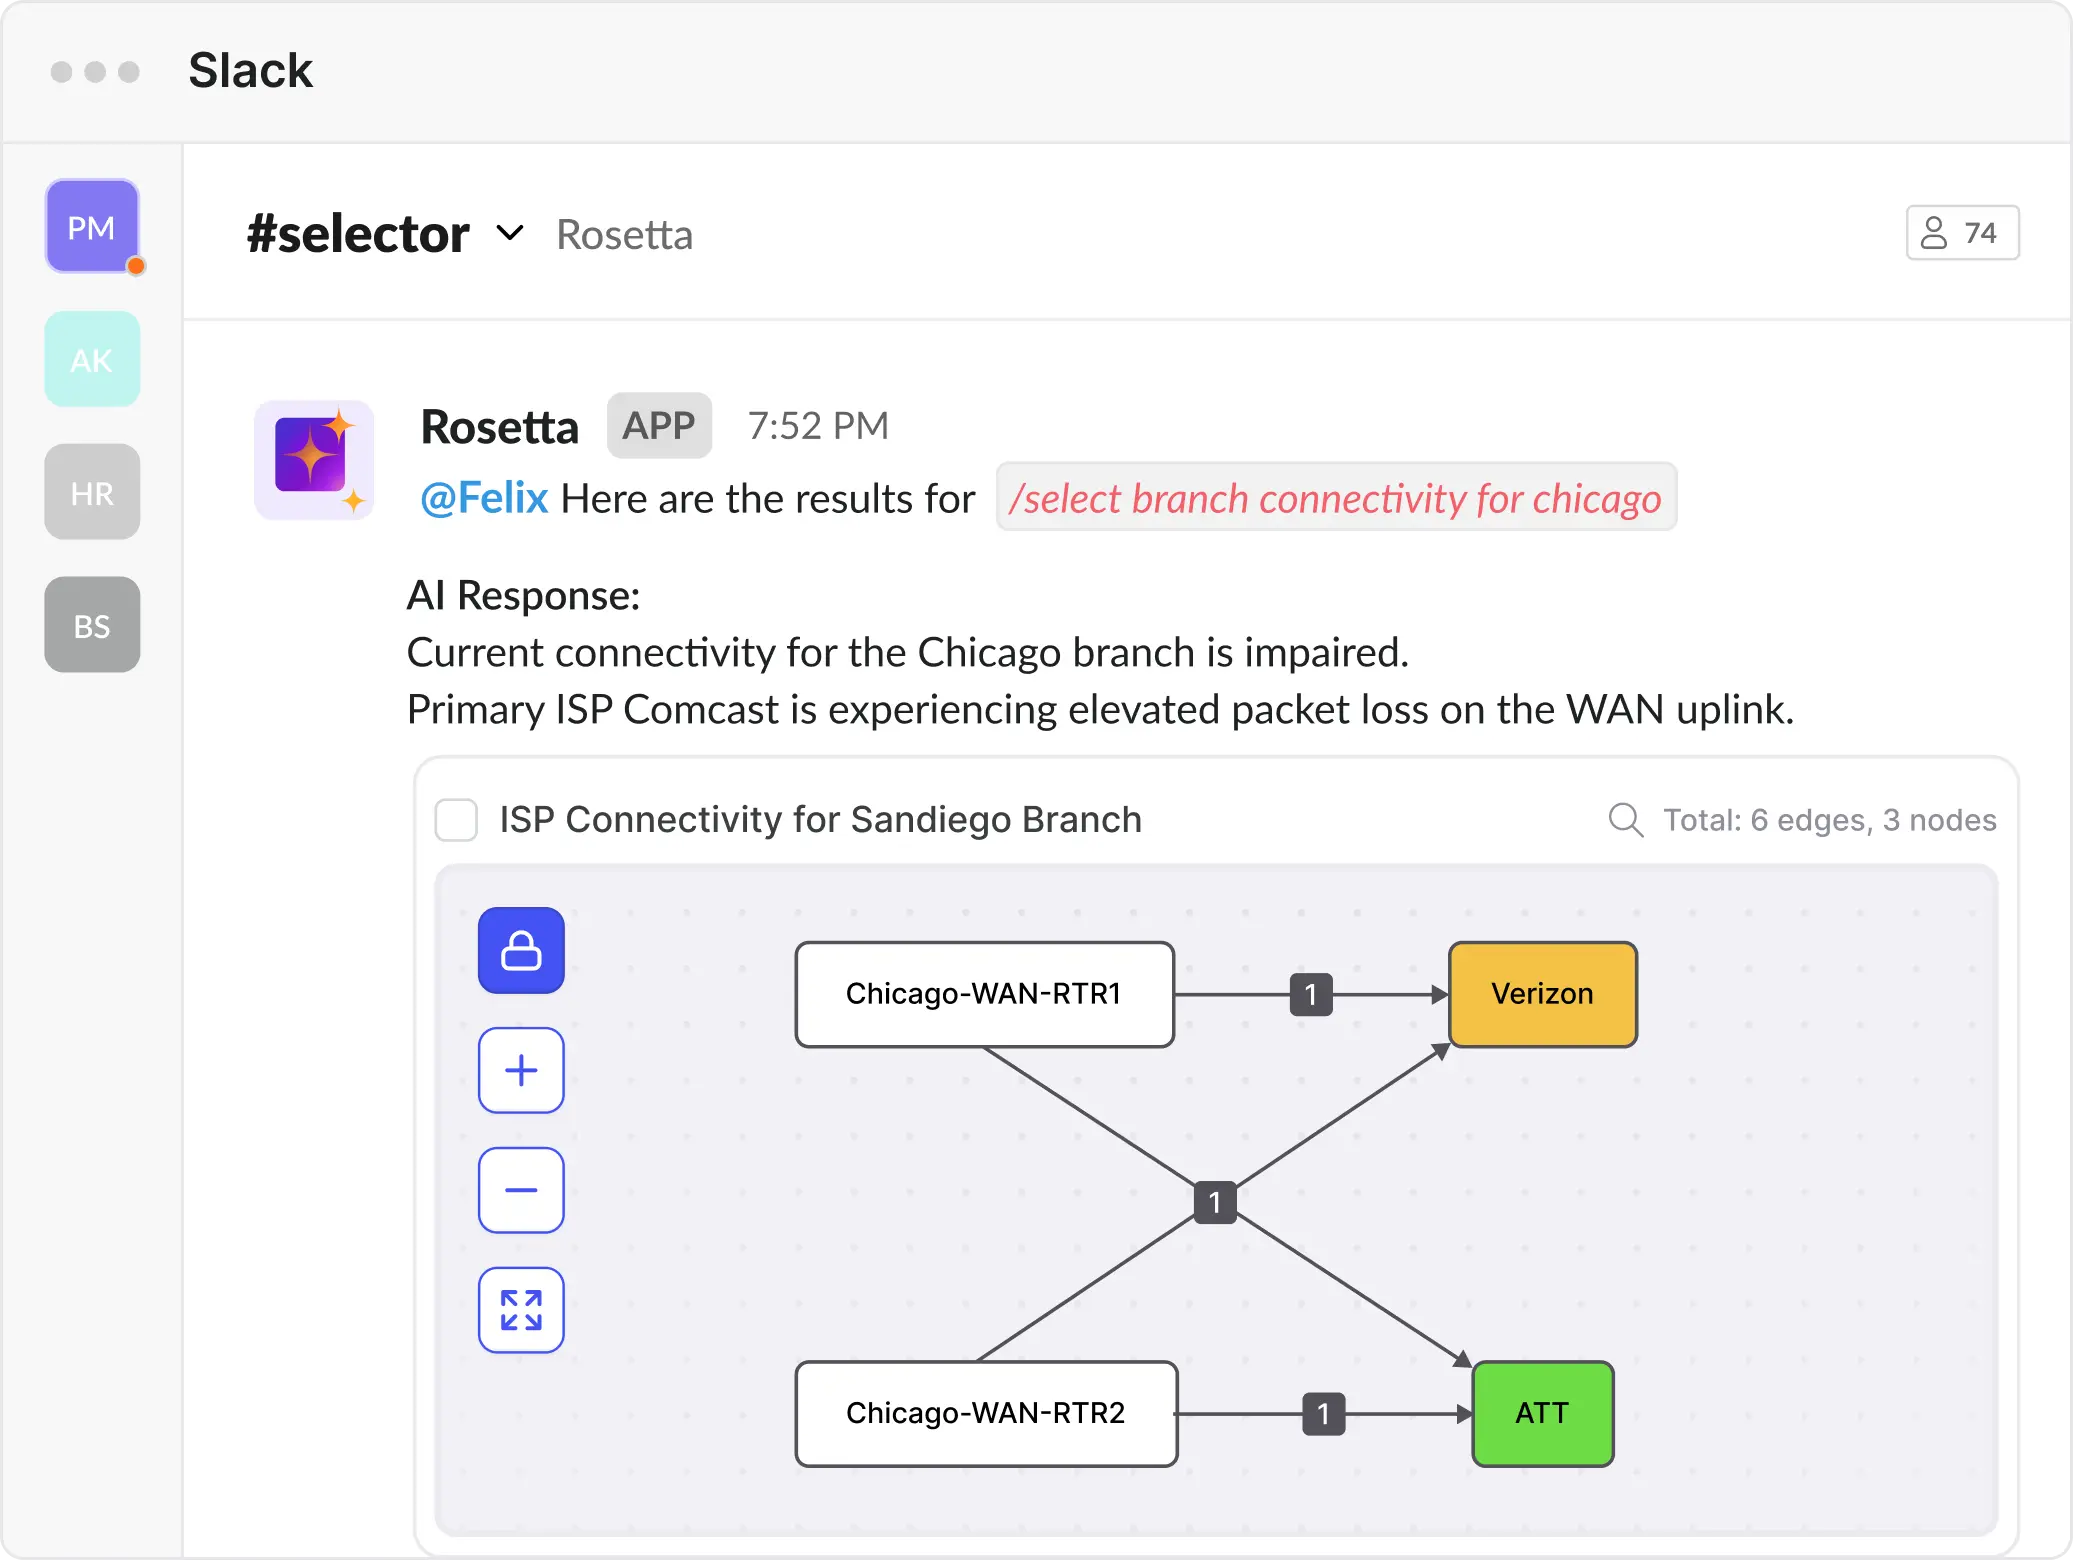
Ask Rosetta in Slack or Teams, and it reasons across Selector and your APM tools over MCP.

Dozens of tools, disconnected data, and endless
context-switching just to confirm what’s broken.

One unified view that shows the full story — from code to cause — so you can act with confidence.
Selector integrates seamlessly with your existing APM,
CI/CD, and telemetry stack — enhancing what you already use without changing how you work.

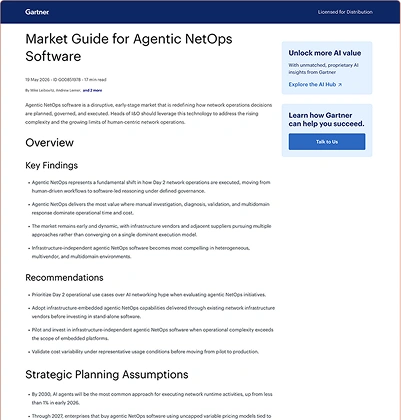
Read Gartners latest resport on Agentic NetOps Software to understand how the market is evolving, which capabilities matter most, and why Selector is recognized as a representative vendor in this emerging market.
Absolutely fantastic company. Their approach to intelligent network monitoring and analytics is unique and refreshing. I can’t recommend them highly enough. I honestly get excited by weekly catch-up calls because of the possibilities.
Principal Engineer, Comcast
Before Selector, we lacked the end-to-end visibility needed to see what was happening across our applications, infrastructure, and network. Now we have a consolidated view of all critical data sources allowing us to proactively detect and resolve issues faster to keep our services running and our customers happy.
VP of IT Operations, TracFone
Our goal is to keep service up – always. With Selector, we are constantly monitoring availability and performance. If an abnormal condition arises, we take immediate action.
Senior Manager of Infrastructure & Software Cloud Delivery, Bell
Selector is a next-generation tool which provides comprehensive visibility and automation capabilities to integrate with other platforms and products. This reduces the burden on our operations team, allowing us to improve incident and change management processes as well as detection and identification of network issues.
Digital Infrastructure Company
Selector has significantly enhanced the operations team workflow by improving alert visibility, correlating alerts, and assigning value to them. Also, the implementation of auto-incidents has been pivotal in reducing missed incidents and helping prioritize those that occur most frequently, enabling us to achieve faster response times.
Digital Infrastructure Company
Selector has provided our operations team with valuable insights and analytics. By analyzing vast amounts of data, Selector can identify patterns, anomalies, and trends, enabling operators to make data-driven decisions and optimize their activities. This has led to improved resource allocation, better capacity planning, and enhanced overall performance.
Digital Infrastructure Company
Selector has played a crucial role in automating and streamlining our operations. By leveraging advanced learning algorithms, Selector can proactively detect and resolve incidents, reducing downtime and minimizing the impact on operations. This has resulted in improved system availability and increased productivity.
Digital Infrastructure Company
Selector has revolutionized our operations and greatly enhanced the efficiency of our team. With the implementation of Selector, operators have experienced significant improvements across network monitoring and incident management.
Digital Infrastructure Company
As a next-generation observability tool, Selector AI is designed to work seamlessly across environments and industries, showcasing the transformative power of AI to elevate network resilience, minimize failures, and mitigate human error.
Digital Infrastructure Company
Selector provides proactive isolation event detection within the routing domain by correlating a range of packet loss metrics, automatically alerting the on-call engineer with precise location data and actionable insights to expedite troubleshooting. This intelligent approach has significantly reduced Mean Time to Repair (MTTR), enabling engineers to zero in on critical metrics that directly enhance customer experience.
Digital Infrastructure Company
Manual monitoring relies on engineers spotting alerts before raising incidents. If an engineer fails to notice an alert, there is a high chance the incident will be missed, along with the opportunity to troubleshoot and restore it promptly. Selector correlation ensures that no incidents are missed.
Digital Infrastructure Company
Selector has been a significant advancement in our network monitoring, marking a major milestone in automation. Prior to Selector, the incident KPI target was a challenge for our operations team. However, with Selector’s correlation capabilities, the time taken to address incidents has been significantly reduced compared to manual processes.
Digital Infrastructure Company