What Are Root Cause Analysis Tools?
Root cause analysis (RCA) tools are methods and software products to identify the underlying reasons why failures, errors, or events occur within processes or systems. Unlike standard troubleshooting, which may focus only on immediate symptoms, RCA tools aim to determine the fundamental causes behind a problem to prevent recurrence.
Common Root Cause Analysis (RCA) techniques include the 5 Whys, which uses a series of “why” questions to find the underlying cause of a problem; the Fishbone (Ishikawa) Diagram, which visually categorizes potential causes; and Failure Mode and Effects Analysis (FMEA), a proactive method for identifying potential failures and their effects.
Technological tools like Selector.ai, TapRoot, and EasyRCA use these and other techniques to help organizations identify the root cause of incidents in their IT infrastructure. By standardizing analysis and documentation, RCA tools promote consistency and enable organizations to gain insights from both individual incidents and broader trends.
This is part of a series of articles about ITOps.
Benefits of Using Root Cause Analysis Tools
Root cause analysis tools offer practical advantages that help teams uncover, understand, and eliminate the sources of problems more effectively. They simplify investigative processes, support data-driven decision-making, and enhance accountability across operations.
Key benefits include:
- Improved problem resolution: RCA tools guide teams beyond surface-level symptoms, enabling deeper investigation to uncover true causes and implement lasting fixes.
- Prevention of recurrence: By identifying and eliminating root causes, these tools help prevent similar issues from reoccurring, reducing downtime and operational disruptions.
- Standardized processes: Most RCA tools offer structured workflows and templates that promote consistency in how investigations are performed and documented.
- Faster investigations: Visual mapping, data analysis, and guided frameworks reduce the time required to complete an investigation compared to unstructured approaches.
- Cross-functional collaboration: RCA tools often support collaborative inputs, making it easier for cross-functional teams to contribute insights and align on solutions.
- Data-backed decisions: Integration with data sources allows RCA tools to use real evidence rather than assumptions, leading to more reliable outcomes.
- Trend analysis and reporting: Many tools track incidents over time, enabling teams to identify systemic issues and prioritize long-term improvements.
How RCA Tools Work: Common RCA Methods and Techniques
5 Whys
The 5 Whys method is one of the simplest and most widely used RCA techniques because of its straightforward approach. It involves taking a problem statement and repeatedly asking “why did this happen?” until the root cause is uncovered. The process usually takes five iterations, though fewer or more may be needed depending on the complexity of the issue. Each answer serves as the basis for the next “why,” allowing teams to peel back layers of symptoms to reach the underlying cause.
This method is best suited for problems with a single or dominant root cause, such as equipment malfunctions or process errors. Its simplicity makes it easy to apply without specialized tools or training, and it encourages a logical, disciplined thought process.
However, the technique has limitations. If participants stop asking questions too early or rely on assumptions instead of data, the analysis may end with a superficial cause. For complex, multi-factor issues, 5 Whys should be combined with other methods like FMEA or Fishbone diagrams for more insights.
Fishbone Diagram
The Fishbone Diagram, also known as the Ishikawa or cause-and-effect diagram, is a structured brainstorming tool that helps teams identify, categorize, and visualize potential causes of a problem. The diagram resembles a fish skeleton: the “head” represents the problem statement, while the “bones” branch out into categories of possible causes. Common categories include people, methods, materials, machines, environment, and measurement, though they can be adjusted based on the industry or situation.
This technique helps organize group discussions by ensuring all aspects of a process are examined systematically. For example, in a manufacturing context, a team investigating product defects could use the diagram to explore whether the root cause lies in operator error, machine calibration, raw material quality, or environmental conditions. The visual layout makes it easier to spot clusters of potential issues and prioritize areas for further investigation.
While the Fishbone Diagram is effective for mapping out possibilities, it does not provide answers on its own. It is most valuable as a starting point for gathering input from cross-functional teams and directing subsequent data collection and testing.
Scatter Diagram
A Scatter Diagram is a statistical tool used to explore potential relationships between two variables. By plotting data points on a two-dimensional graph, teams can visually assess whether changes in one factor are associated with changes in another. For example, a scatter diagram might reveal whether increasing machine speed correlates with higher defect rates, or whether staff overtime hours correlate with customer complaints.
Patterns in the plotted points can suggest different types of relationships. A clear upward or downward slope may indicate a positive or negative correlation, while a random distribution of points suggests no meaningful relationship. This helps teams test hypotheses about cause-and-effect and narrow down which factors are worth investigating further.
However, scatter diagrams have limitations. They only show correlation, not causation. Two variables may appear related but be driven by a third factor not represented in the diagram. For this reason, scatter diagrams are often used in combination with other RCA tools, serving as evidence to support or challenge assumptions during an investigation.
Pareto Chart / Analysis
Pareto Analysis applies the 80/20 rule, which states that roughly 80% of effects come from 20% of causes. A Pareto Chart is a bar graph that ranks issues in order of frequency, cost, or impact, with the most significant contributors appearing on the left. A cumulative line is often added to show the proportion of total problems accounted for by the leading causes.
This method is especially useful when organizations face a large number of recurring issues but have limited resources to address them all. For example, a service desk may use Pareto Analysis to determine that most customer complaints stem from only two or three types of system errors. By addressing these high-priority issues first, the team can achieve a significant improvement with minimal effort.
Pareto Charts provide a data-driven way to focus problem-solving efforts, making them popular in quality management, manufacturing, and service operations. However, they are descriptive rather than diagnostic. They show where to focus attention but do not explain why the issues occur, so they are most effective when paired with deeper investigative techniques such as Fishbone diagrams or FMEA.
Failure Mode and Effects Analysis (FMEA)
Failure Mode and Effects Analysis (FMEA) is a systematic approach to identify where and how a process, product, or system might fail and to assess the potential consequences of those failures. Each possible failure mode is examined for three key factors: severity (the seriousness of the effect), occurrence (the likelihood of the failure happening), and detectability (the chance of identifying the issue before it causes harm). These factors are combined into a risk priority number (RPN), which helps teams prioritize which risks require immediate action.
FMEA is highly structured, often documented in detailed worksheets that list process steps, potential failure modes, causes, and recommended corrective actions. It is widely used in industries where reliability and safety are critical, such as automotive, aerospace, and healthcare. For example, in medical device manufacturing, FMEA can help teams anticipate and prevent failures that could endanger patients.
The technique is preventive in nature, making it most effective when applied during design or process development stages. Its main limitation is that it can be time-consuming and resource-intensive, especially for complex systems with many components. Nonetheless, its systematic nature makes it one of the most powerful tools for proactive risk management.
Fault Tree Analysis (FTA)
Fault Tree Analysis (FTA) is a top-down, deductive approach used to analyze how failures occur within complex systems. The process begins with a clearly defined undesirable event, such as a system crash or safety incident, and maps backward to identify all possible contributing factors. Logical gates, such as AND and OR, are used to represent how different combinations of events or conditions can lead to the top-level failure.
The resulting fault tree provides a structured, visual representation of cause-and-effect relationships, making it easier to understand how individual failures interact within a system. Quantitative analysis can also be applied, with probabilities assigned to basic events, allowing teams to calculate the overall likelihood of the top-level failure.
FTA is especially valuable in industries where failure consequences are severe, such as aerospace, nuclear energy, and defense. It helps engineers identify critical failure points, prioritize preventive measures, and support compliance with safety regulations. However, creating accurate fault trees requires detailed system knowledge and reliable data, and the analysis can become complex for large systems.
Notable Root Cause Analysis Tools
1. Selector
Selector is an AI-driven observability and AIOps platform that performans automated correlation and root cause analysis across networks, infrastructure, and related services. It ingests heterogenous telemetry (events, logs, metrics, and network signals such as NetFlow/gNMI/BMP) and unifies them into a common model, allowing teams to quickly isolate the most likely cause, assess blast radius, and validate fixes. Built for hybrid, multi-domain environments, Selector emphasizes a data-centric approach so RCA is explainable, repeatable, and fast.
Key features include:
- Multi-telemetry correlation & causal grouping: Automatically links symptoms, changes, and dependencies to surface a single, probably root cause rather than a list of alerts.
- Topology- and dependency-aware analysis: Uses device, interface, and service relationships to trace faults through layers (L2-L6) and tie application health to underlying infrastructure conditions.
- Change intelligence for RCA: Highlights recent config and state changes (e.g., diffs) that preceded incidents to speed “what changed?” investigations.
- Natural-laguage Copilot: Lets operators ask plain-English questions (“Why did latency spike in region X? “) and receive evidence-backed esplanations and next steps.
- Incident timelines & reporting: One-click timelines, post-incident summaries, and trend views to prevent recurrence and document corrective actions.
- Open Integrations: connects with common data sources and ticketing/ITSM tools to capture evidence, create tasks, and track remediation to closure.
2. TapRooT
TapRooT® is a structured root cause analysis system to help organizations identify and correct the underlying causes of incidents, especially those involving human errors or equipment failures. It combines clearly defined investigative processes, evidence-based analysis, and specialized training to improve performance in safety, reliability, and quality.
Key features include:
- Structured investigation framework: Provides a consistent, step-by-step approach for conducting incident investigations and identifying root causes.
- Incident investigation software: Offers tools for documenting incidents, analyzing causes, and tracking corrective actions to resolution.
- Equifactor® equipment analysis: Integrates equipment troubleshooting techniques to pinpoint causes of recurring mechanical and technical failures.
- Training and certification: Offers public and on-site courses to build investigator skills and standardize RCA practices across teams.
- Cross-industry application: Used in industries like oil and gas, manufacturing, pharmaceuticals, and utilities where performance and safety are critical.

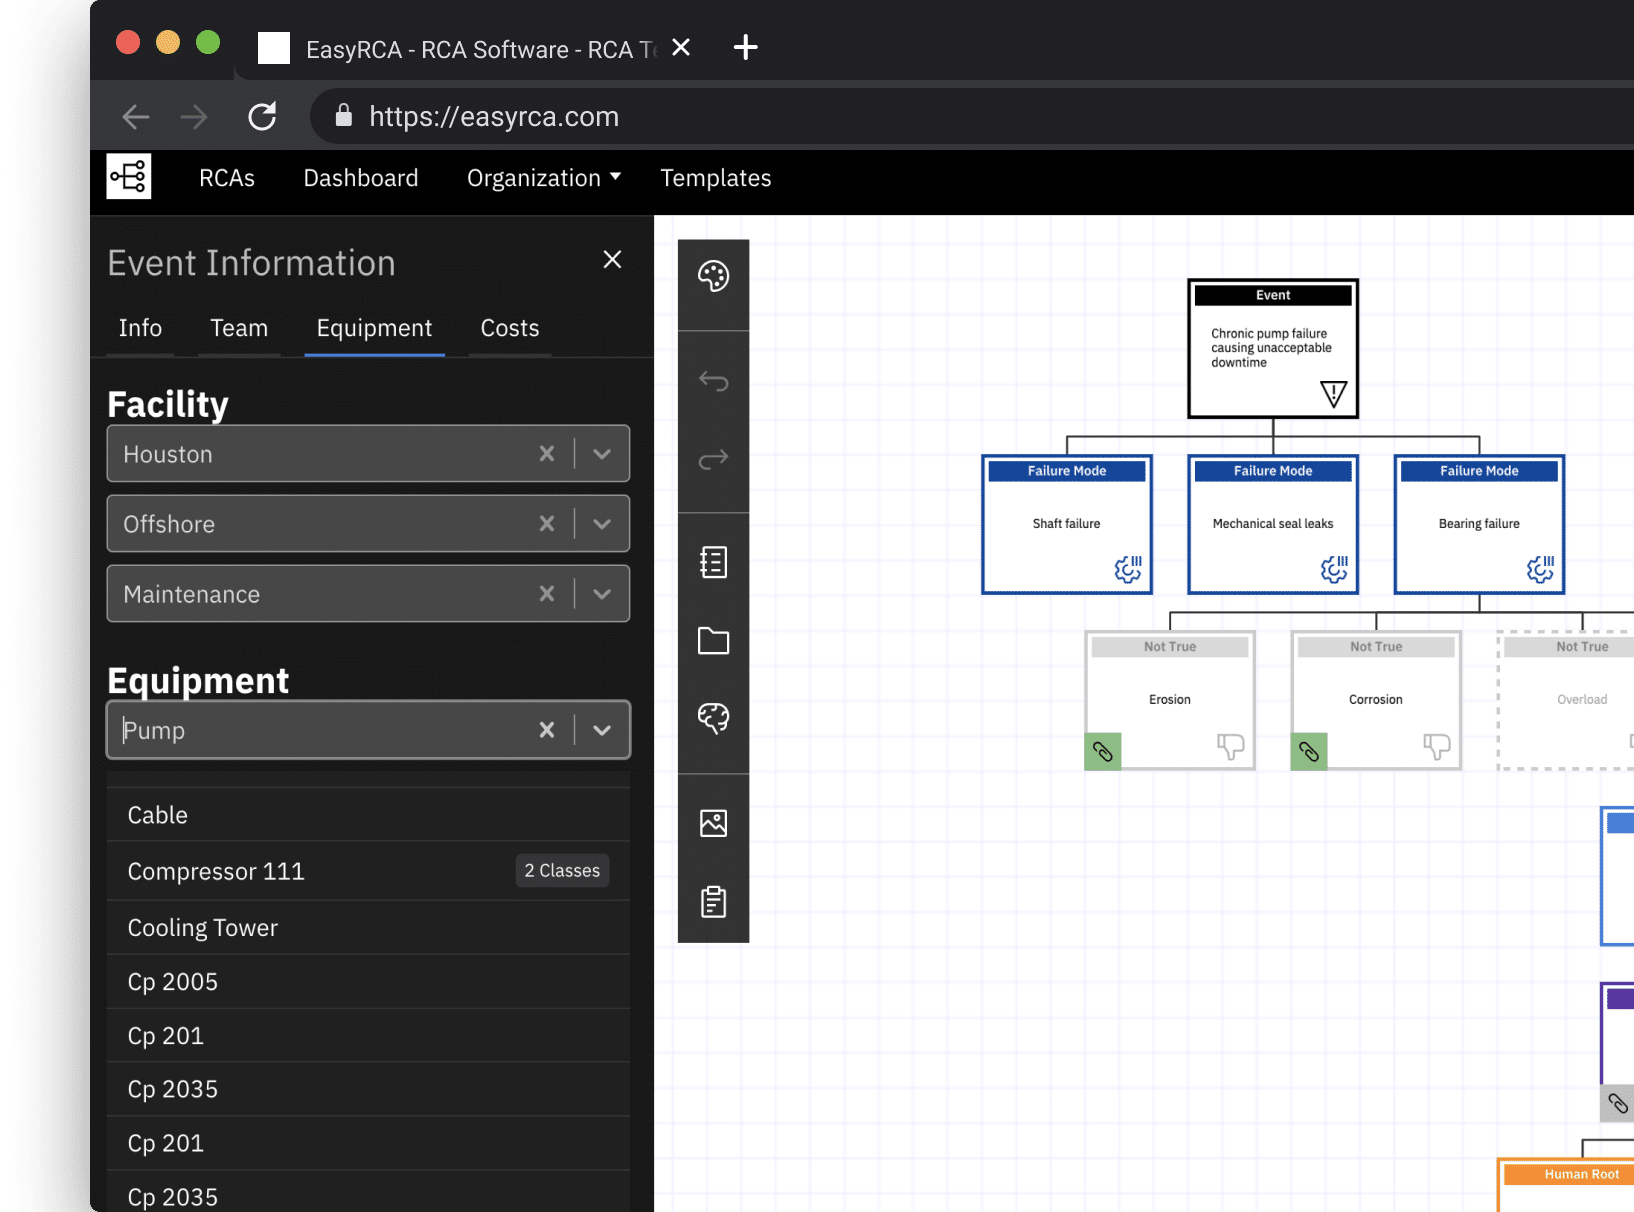
3. EasyRCA
EasyRCA is a root cause analysis software platform to simplify and standardize RCA practices across organizations. It enables teams to apply proven methodologies quickly, track investigations, and ensure that corrective actions are implemented and monitored.
Key features include:
- Centralized RCA program management: Manage all root cause investigations in one platform, making RCA accessible and consistent across teams and sites.
- Visual analysis tools: Simplifies investigation through graphical tools that help teams map out problems, contributing factors, and causes.
- One-click custom reports: Generate clean, tailored RCA reports for stakeholders with minimal effort.
- Corrective action tracking: Monitor the implementation and effectiveness of countermeasures through an integrated Action Center.
- Searchable RCA database: Store and retrieve completed RCAs easily to support knowledge sharing and future problem-solving.

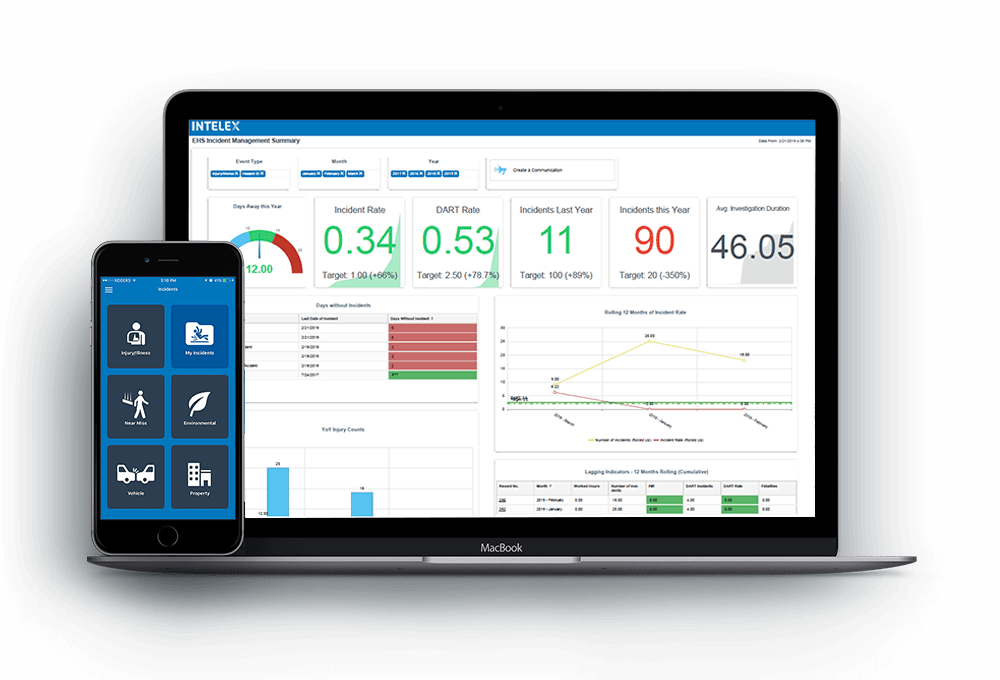
4. Intelex
Intelex Root Cause Analysis software is a cloud-based solution that equips organizations with a suite of RCA tools and methodologies to identify, address, and prevent process and product failures. It enables teams to manage investigations, analyze trends, and implement corrective actions from a web-based platform.
Key features include:
- Centralized incident data management: Capture and manage incident and RCA data in one location to simplify analysis, tracking, and reporting.
- Tailored RCA methodologies: Supports multiple analysis techniques, including 5 Whys, Fishbone diagrams, TapRooT, and gap analysis, allowing teams to apply the method best suited to each problem.
- Integrated workflow and notifications: Automates process steps and stakeholder communications to ensure timely investigations and follow-through on actions.
- Trend and cause analysis: Combines current incident data with historical records to identify recurring issues and guide risk mitigation strategies.
- Corrective and preventive action (CAPA) management: Helps teams close the loop by linking root causes to action plans and tracking implementation across departments.

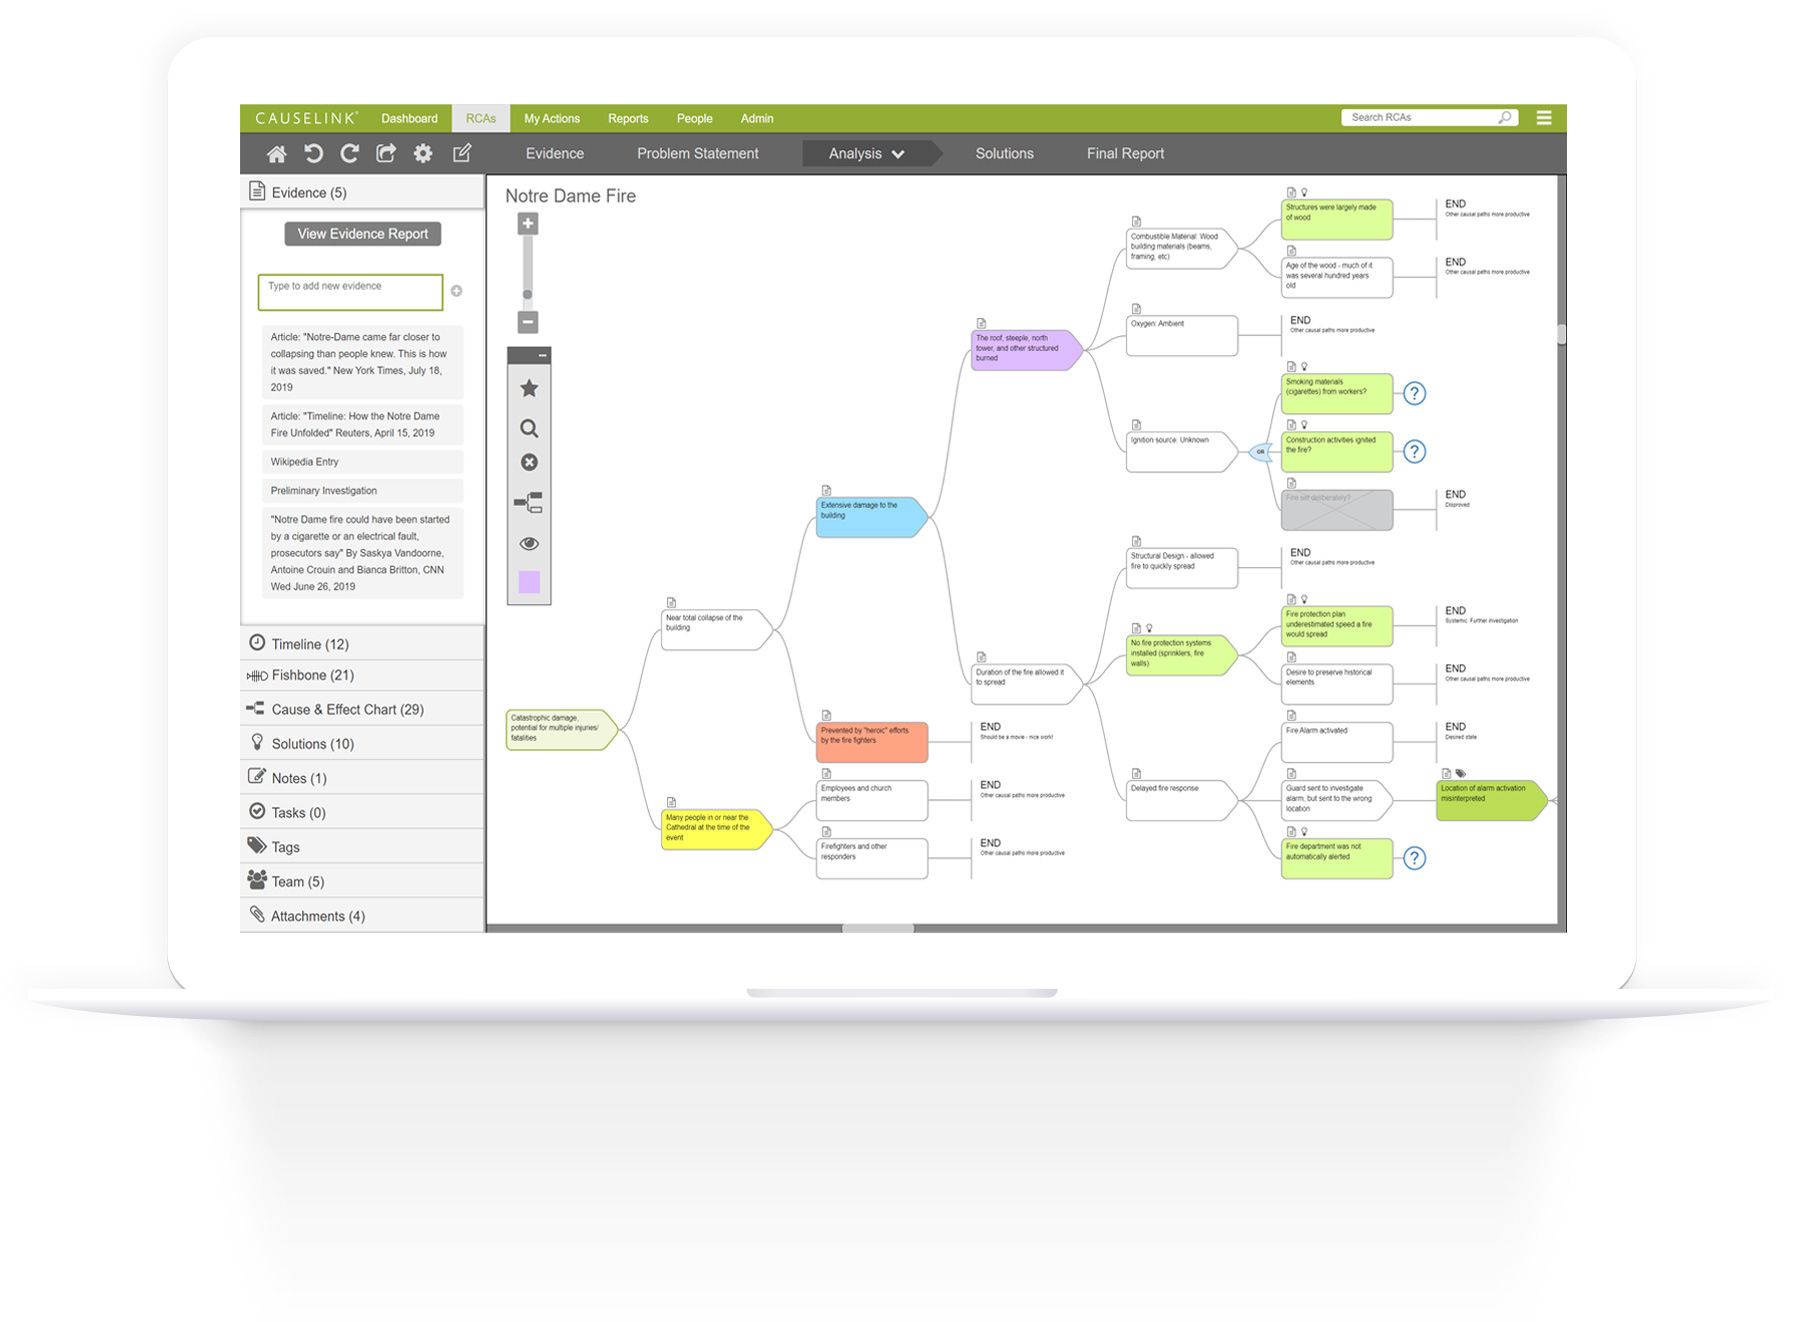
5. Causelink
Causelink is a purpose-built RCA and failure mode and effects analysis (FMEA) software platform to simplify investigations and improve organizational learning. It replaces analog tools like sticky notes and flipcharts with structured, collaborative digital features that support popular RCA methods such as 5 Whys, Fishbone diagrams, and cause-and-effect logic trees.
Key features include:
- Support for multiple RCA methods: Includes tools for 5 Whys, Fishbone diagrams, cause-and-effect logic trees, incident timelines, and FMEA.
- Drag-and-drop investigation tools: Visual tools make it easy to structure problems, organize evidence, and build RCA diagrams collaboratively.
- AI-powered solutions and reports: Offers automated solution suggestions and report writing assistance, helping teams complete investigations faster.
- Action tracking workflow: Assign corrective and preventive actions, monitor progress, and ensure resolution with solution tracking.
- Evidence and documentation management: Capture problem statements, supporting evidence, causes, and solutions in a structured format that supports learning and audit readiness.

Conclusion
Root cause analysis tools provide organizations with structured ways to move beyond surface-level fixes and uncover the underlying drivers of failures, errors, and inefficiencies. By standardizing investigative methods, these tools not only accelerate problem resolution but also support preventive measures that strengthen long-term reliability. When integrated into daily operations, RCA practices enhance organizational learning, improve compliance, and reduce the likelihood of repeat incidents.
Learn more about how Selector’s AIOps platform can transform your IT operations.
To stay up-to-date with the latest news and blog posts from Selector, follow us on LinkedIn or X and subscribe to our YouTube channel.