What Is Network Monitoring Software?
Network monitoring software tracks various network components, including routers, switches, servers, and endpoints, using protocols like SNMP, ICMP, or NetFlow. Its goal is to ensure network performance, reliability, and security by detecting faults, performance bottlenecks, and security breaches in real time.
The software typically provides administrators with dashboards, alerts, and historical data to facilitate proactive decision-making and quicker troubleshooting. Whether deployed in a small business or a complex enterprise environment, network monitoring tools help reduce downtime, optimize bandwidth usage, and enhance overall user experience by giving visibility into every critical aspect of the network.
Key Components of Network Monitoring Software
Network Discovery and Topology Mapping
Network discovery is the automated identification of devices and connections within a network. Modern network monitoring tools use discovery protocols such as SNMP, LLDP, and CDP to detect new or rogue devices and build a complete inventory without manual input. This automated discovery speeds up initial deployment and ensures ongoing accuracy as the network evolves.
Topology mapping visually illustrates how devices and segments interconnect. These maps update dynamically to reflect real-time changes, making it easier to understand the physical and logical layout. Accurate topology aids troubleshooting, capacity planning, and rapid fault isolation, particularly in sprawling environments with mixed infrastructure.
Data Collection Protocols
Data collection is the backbone of network monitoring solutions, which rely on protocols to gather actionable information. Simple Network Management Protocol (SNMP) is widely used for polling device status, performance counters, and configurations. Other key protocols include ICMP for basic reachability checks, NetFlow and sFlow for traffic analysis, and syslog or SNMP traps for event notifications.
Beyond routine status checks, modern monitoring platforms support multiple collection methods and push-based mechanisms to minimize polling load. Support for various standards ensures compatibility with a range of network gear. Flexible protocol handling allows organizations to monitor legacy devices alongside new network assets without gaps in visibility.
Metrics: Latency, Throughput, and Availability
Latency, throughput, and availability are core metrics that underpin effective network performance monitoring. Latency measures the time it takes for data to traverse the network—critical for real-time applications. High latency can degrade voice, video, and transaction-heavy services, so tracking this metric helps administrators identify and address bottlenecks quickly.
Throughput measures the rate at which data moves through the network, revealing bandwidth utilization and potential congestion. Monitoring availability ensures that key devices and services remain accessible and functional. These metrics are often collected at granular intervals, enabling trend analysis, proactive capacity management, and benchmarking against service-level agreements (SLAs).
Visualization and Alerting
Visualization tools present network data via dashboards, charts, and maps, allowing quick assimilation of complex information. Administrators use graphical interfaces to spot trends, analyze historical performance, and isolate incidents with a few clicks. Good visualization reduces troubleshooting time and provides stakeholders with easy-to-interpret insights.
Alerting systems enable immediate notification when anomalous conditions are detected, such as outages, threshold breaches, or configuration changes. Alerts can be sent via email or SMS, or integrated with ITOM platforms for automated ticket creation. Advanced alerting minimizes response time, limits manual intervention, and helps teams focus on priorities without sifting through noisy or redundant notifications.
Essential Features to Look For in a Network Monitoring Software
Real-Time Monitoring and Anomaly Detection
Real-time monitoring equips network teams with up-to-the-moment information, ensuring problems are caught as soon as they arise. The best solutions process and display data with minimal delay, enabling rapid isolation of outages or degraded performance. This real-time visibility is essential for meeting SLAs.
Anomaly detection adds intelligence by highlighting deviations from historical norms or preset thresholds. Rather than relying on manual reviews, anomaly detection algorithms automatically flag unusual patterns, such as unexpected traffic spikes or drops in device availability. This feature increases operational efficiency, helping teams spot and address both subtle and critical issues faster.
Custom Dashboards and Reporting
The ability to create custom dashboards enables administrators to tailor views by role, location, or responsibility. Dashboards provide high-level overviews for management and detailed metrics for technicians, allowing users to navigate directly to problem areas. Personalization supports multi-team collaboration and makes it easier to monitor hybrid or segmented networks.
Reporting is equally essential for compliance, trend analysis, and executive communication. Automated, scheduled reports can summarize performance, incidents, and capacity trends over configurable timeframes. Practical reporting tools allow teams to set baselines, forecast growth, and document network health for both regulatory and operational needs.
Scalability and Multi-Vendor Support
Network environments constantly evolve, requiring monitoring tools to scale as new users, devices, and locations are added. Scalable solutions handle growth without performance degradation, supporting everything from small sites to large, complex campuses and cloud infrastructures. Features such as distributed polling and data aggregation help efficiently manage increased load.
Multi-vendor support ensures compatibility across a diverse fleet of devices and platforms. Enterprise networks often incorporate equipment from multiple manufacturers, each with proprietary management protocols. A robust monitoring platform supports open standards and vendor-specific integrations, providing unified visibility and control irrespective of hardware brand or technology.
Automation and AI-Assisted Analysis
Automation reduces the manual workload in monitoring and managing networks. Routine tasks, such as configuration backups, remedial scripts, or device discovery, can be scheduled and orchestrated to maintain baseline hygiene. Automated workflows minimize human error and free up resources for strategic initiatives.
AI-assisted analysis brings predictive and prescriptive analytics to the monitoring process. Machine learning models can forecast future bottlenecks, recommend remediation actions, and prioritize alerts based on severity and business impact. These capabilities enhance situational awareness and drive faster, smarter decisions, even in highly dynamic or cloud-centric environments.
Learn more in our detailed guide to network automation tools.
Integration with ITSM and SIEM Systems
Integration with IT service management (ITSM) and security information and event management (SIEM) systems bridges the gap between network monitoring and broader IT operations. Automated creation of incident tickets from alerts ensures consistent, traceable resolution workflows. Tight integration shortens the time from detection to response, closing the loop between NOC and service desk.
On the security side, feeding actionable network events into SIEM platforms enriches security analytics and incident investigations. Correlating network data with security events provides early warning of threats such as lateral movement or data exfiltration. Seamless integrations drive efficiency and enable holistic, organization-wide IT management without algorithmic or informational silos.
Notable Network Monitoring Software
1. Selector
Selector provides AI-driven network monitoring that unifies observability, correlation, and automation in a single platform. It continuously analyzes network telemetry across metrics, logs, events, and topology to deliver real-time visibility and actionable insights. By integrating anomaly detection, root cause analysis, and predictive intelligence, Selector enables teams to identify issues faster and maintain optimal performance across hybrid and multi-domain environments.
Key features include:
- Full-stack visibility: Monitors physical, virtual, and cloud infrastructure from a single pane of glass.
- Automated correlation and RCA: Connects related alerts to surface root causes instantly.
- AI-assisted anomaly detection: Identifies deviations in network behavior before they affect users.
- Custom dashboards and reports: Provide role-based insights for network, IT, and operations teams.
- Seamless integrations: Connects with ITSM, observability, and collaboration tools for unified workflows.
Selector transforms network monitoring from reactive alerting to proactive, intelligent operations — helping teams reduce MTTR, enhance reliability, and ensure continuous performance at scale.

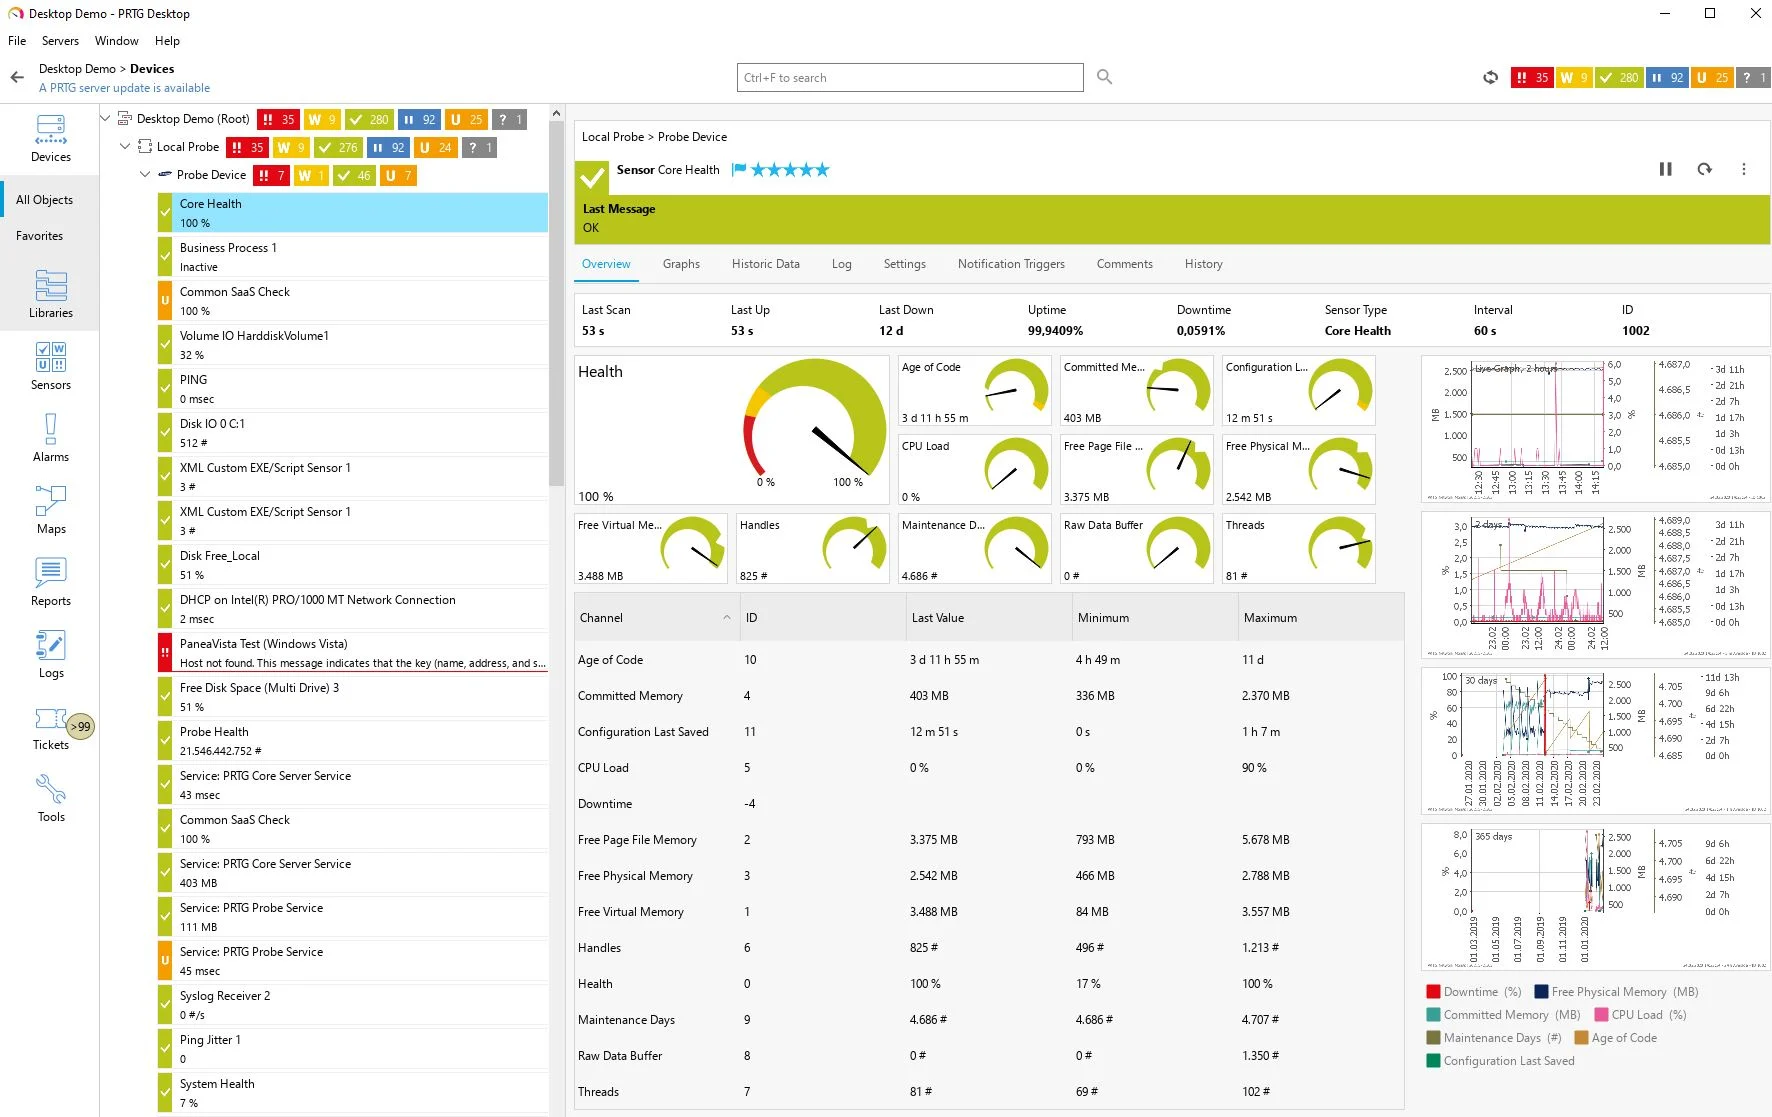
2. PRTG Network Monitor
PRTG Network Monitor is a solution that enables organizations to monitor their IT infrastructure through a single platform. It offers visibility into systems, devices, traffic, and applications, helping teams detect outages, performance issues, or unusual activity. PRTG supports monitoring across local networks, servers, databases, applications, and cloud services.
Key features include:
- Unified monitoring: Tracks network devices, servers, applications, databases, and cloud services in one interface
- Sensor-based architecture: Uses configurable sensors to tailor monitoring to specific needs across IT components
- SNMP support: Enables monitoring of multi-vendor environments with standard and proprietary SNMP protocols
- Visualization tools: Offers maps and customizable dashboards using a map designer
- Notification system: Sends alerts via email, push notifications, and HTTP requests based on custom thresholds
Limitations (as reported by users on G2):
- Sensor-based licensing can become expensive as network size grows
- Performance degrades in large or complex environments, especially with many sensors
- Web and mobile dashboards may lag under high load
- Steep learning curve for advanced configuration and custom reporting
- Initial setup can be complex due to licensing structure and template creation

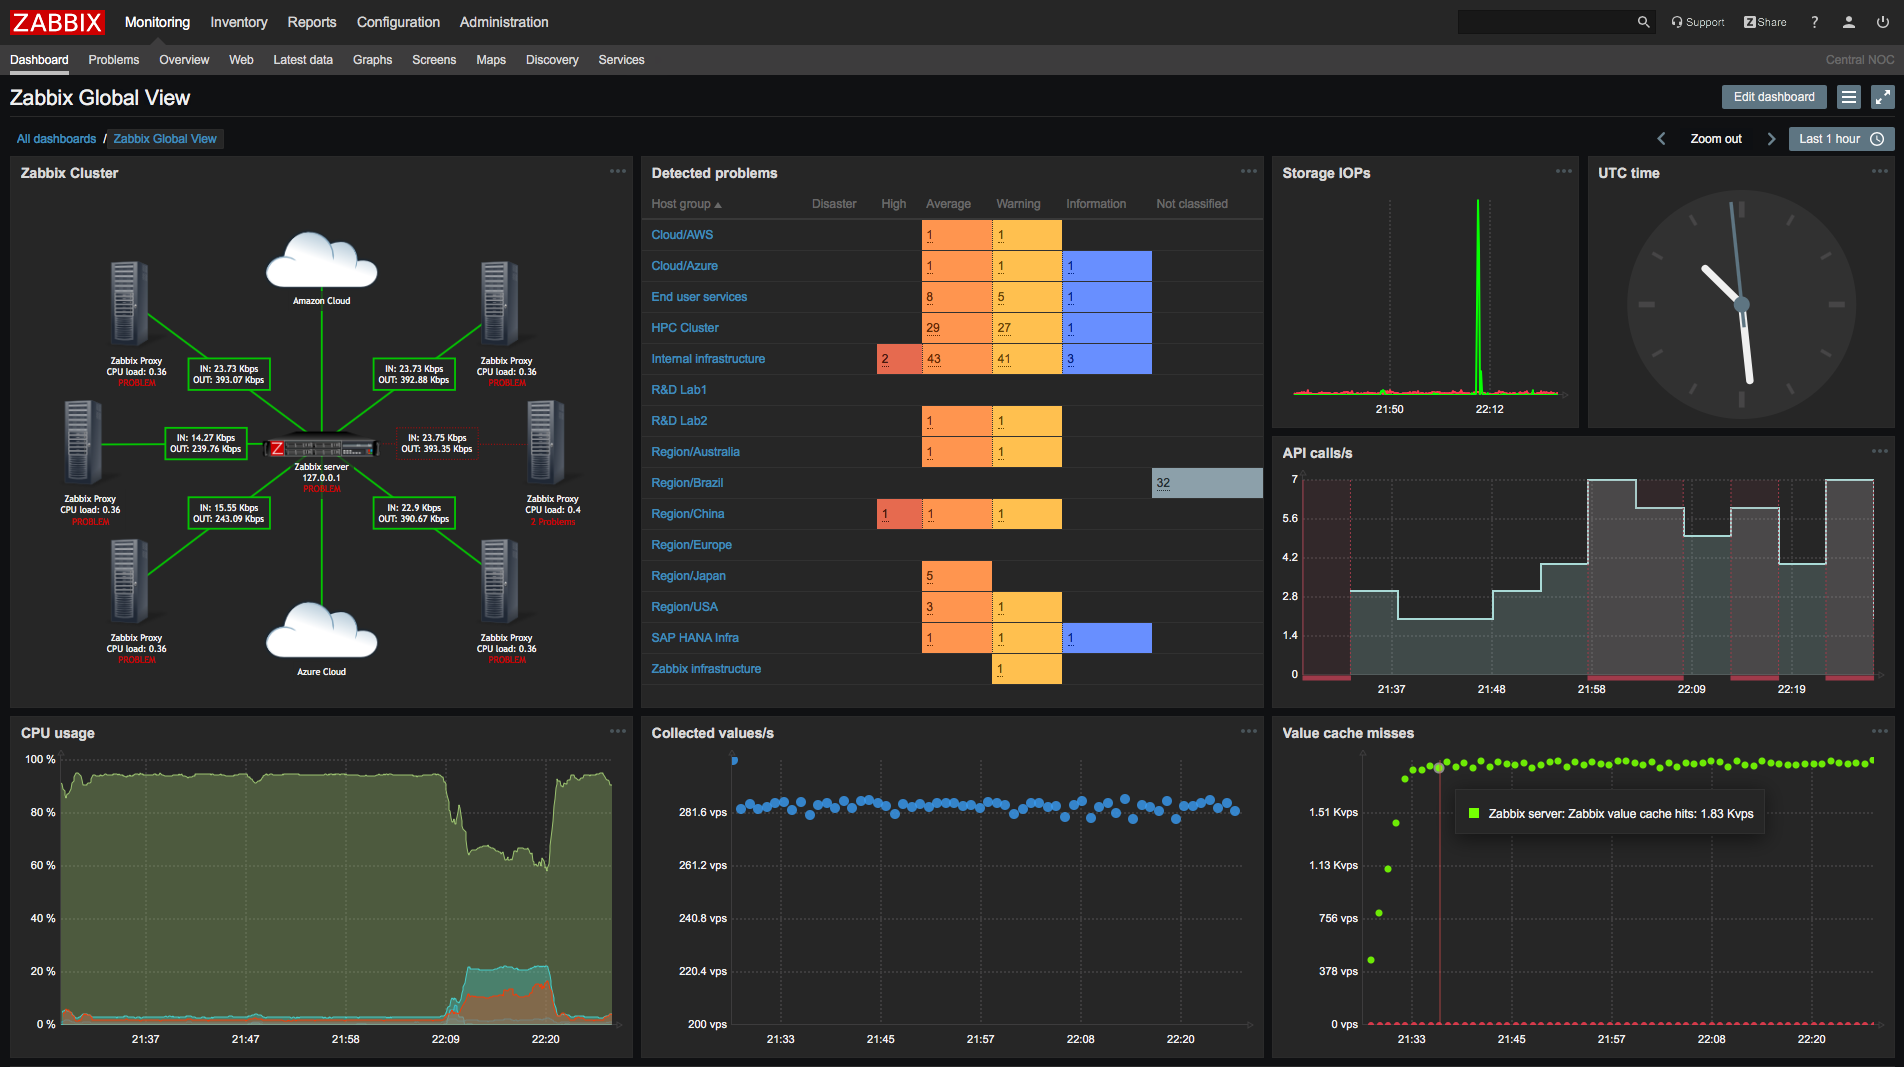
3. Zabbix
Zabbix is a scalable network monitoring solution that enables organizations to monitor the health and performance of their network infrastructure. It supports SNMP and agent-based monitoring, allowing users to collect metrics such as bandwidth usage, packet loss, and device status from a range of network hardware.
Key features include:
- Network metrics: Monitors traffic, bandwidth, packet loss, interface errors, and TCP connections
- Multi-protocol support: Collects SNMP v1/v2c/v3 data, traps, and agent-based metrics from legacy and modern devices
- Device health monitoring: Tracks uptime, CPU/memory usage, power supply, temperatures, and fan status
- Alerting capabilities: Defines thresholds, suppresses alerts during maintenance, and detects anomalies with dynamic baselines
- Escalation management: Supports multi-level alert escalation across users and departments with custom workflows
Limitations (as reported by users on G2):
- Steep learning curve, especially for users without prior configuration experience
- Setup and customization are complex, particularly for new users
- Documentation and community support are insufficient for some users’ needs
- Lack of guided configuration may slow deployment for non-experts

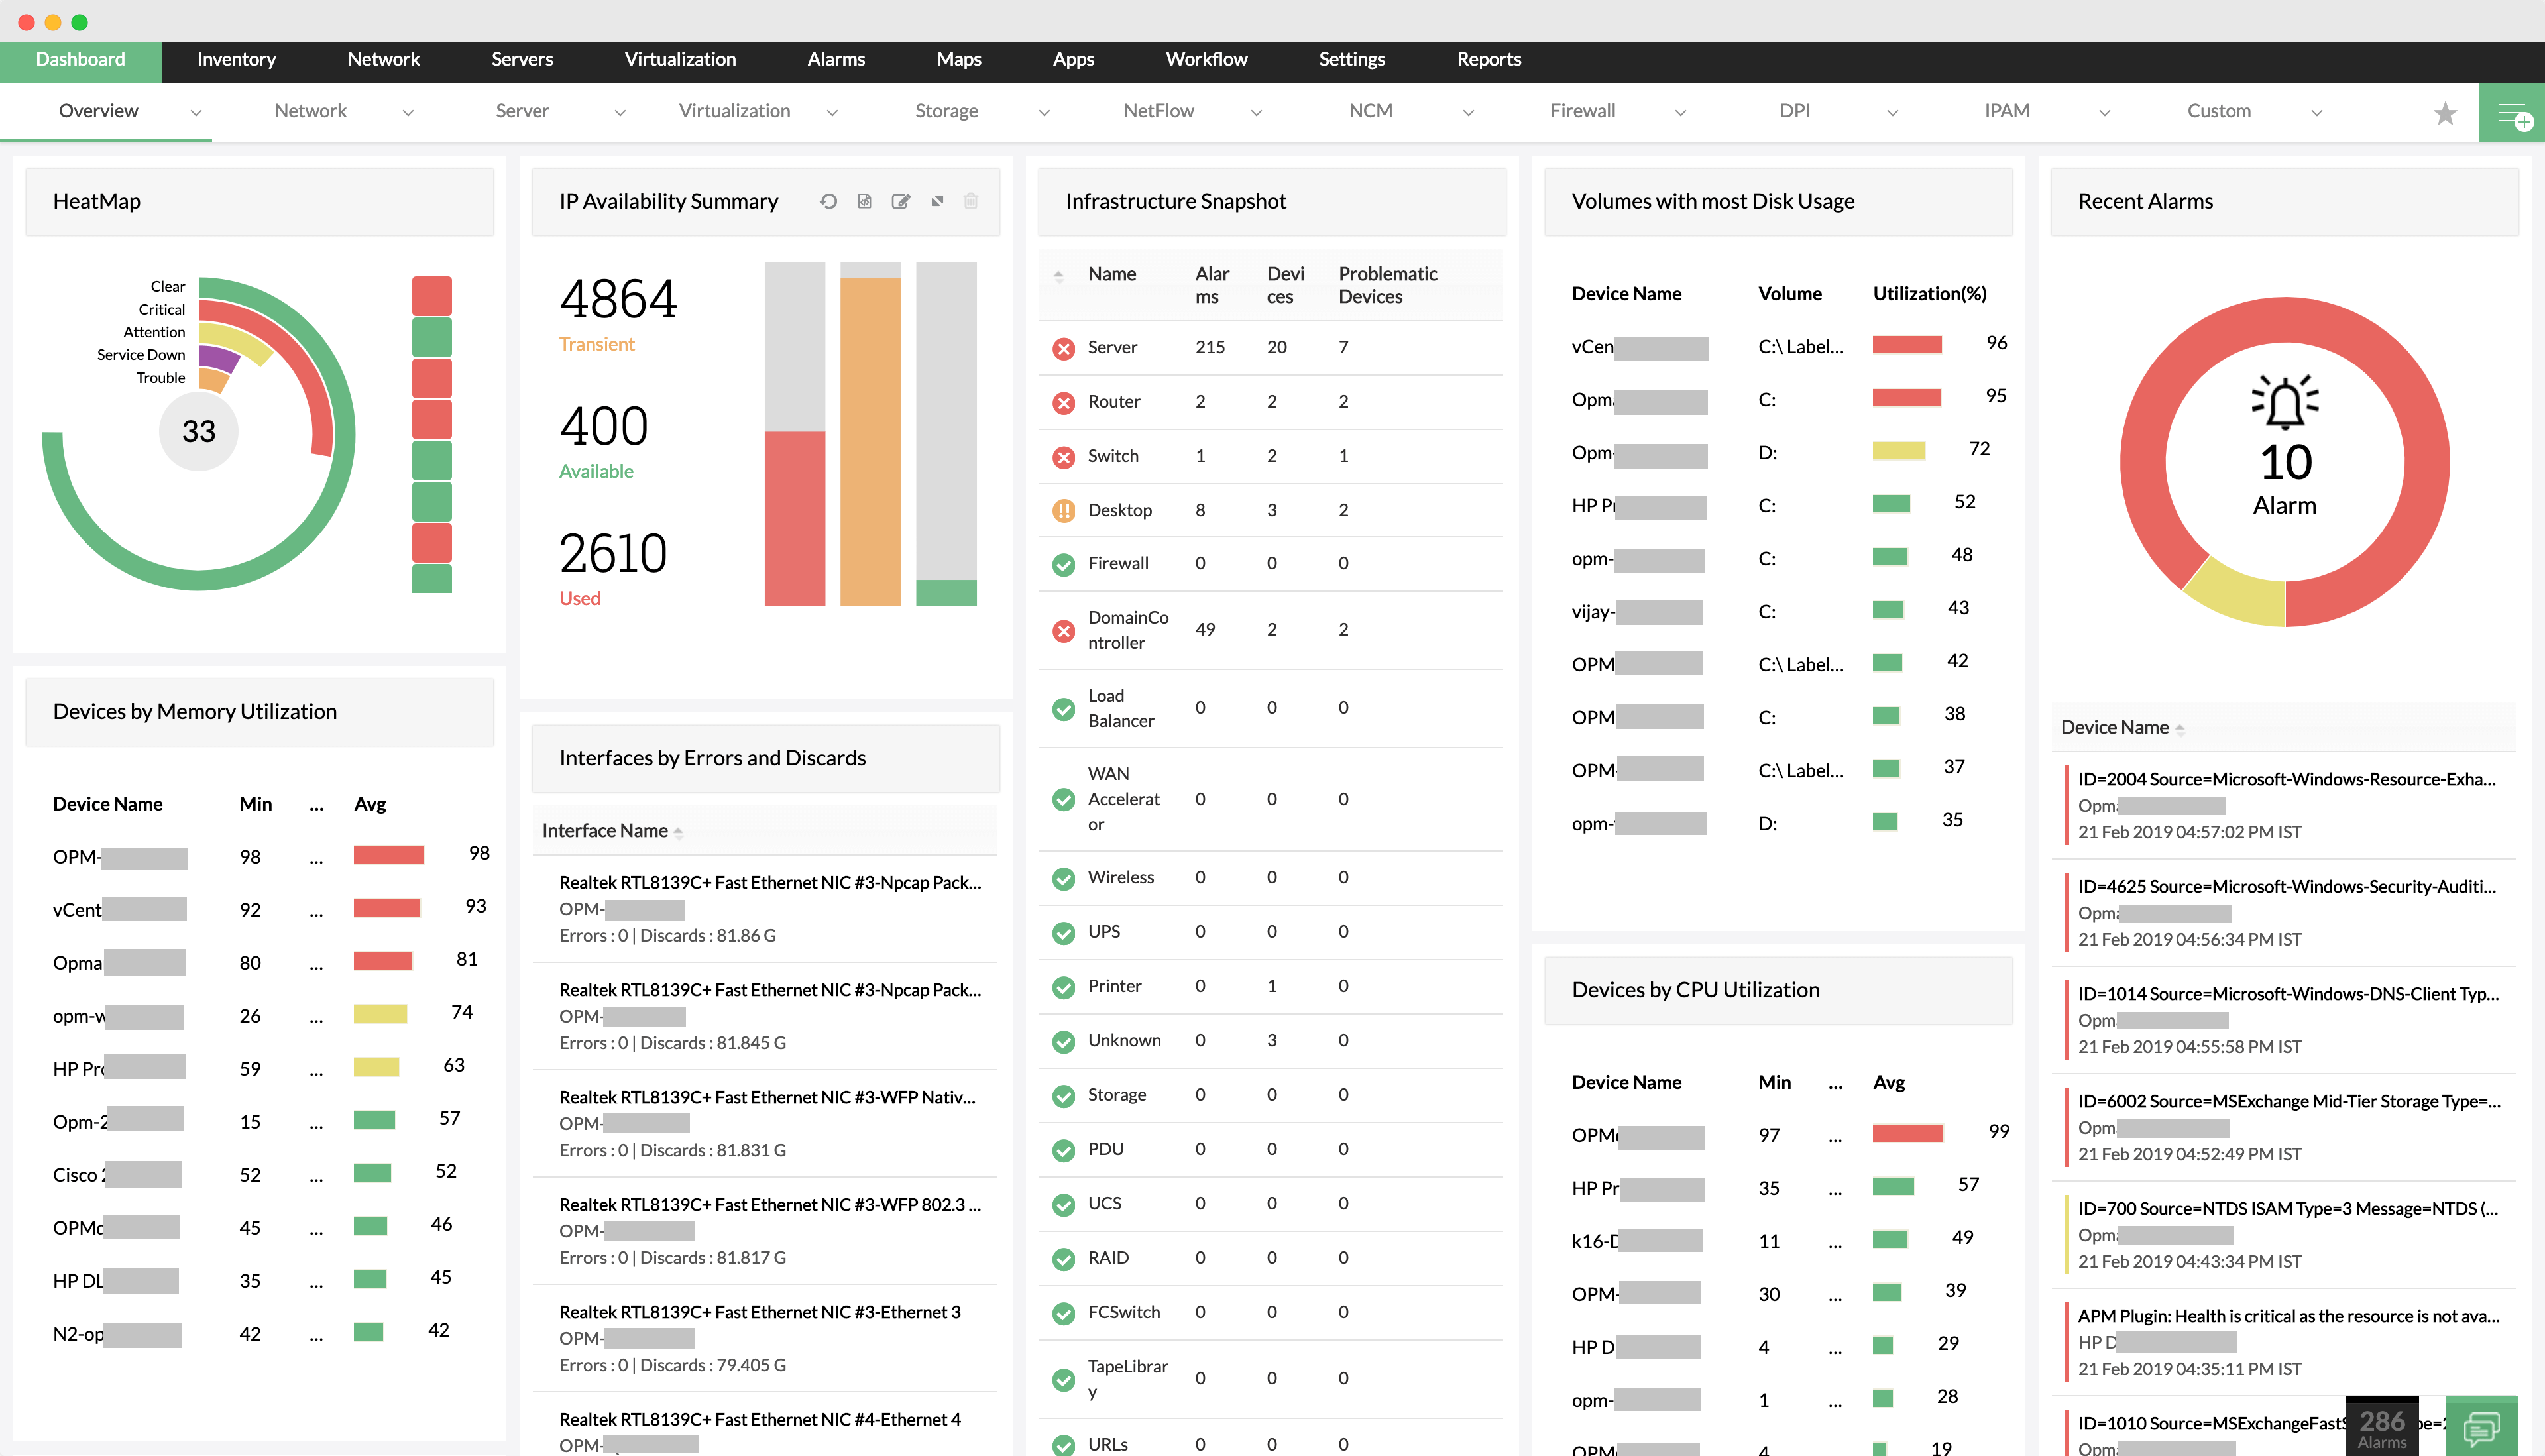
4. ManageEngine OpManager
ManageEngine OpManager is an integrated network monitoring solution for visibility across IT infrastructure. It monitors the health, availability, and performance of routers, switches, firewalls, wireless devices, servers, virtual machines, and storage systems. It supports distributed monitoring, WAN link tracking, and Cisco ACI environments.
Key features include:
- Device monitoring: Tracks performance and availability for IP-based devices, including routers, switches, firewalls, and access points
- Server and virtualization support: Monitors physical and virtual servers (VMware, Hyper-V, Citrix, Nutanix) to ensure optimal uptime and resource usage
- Wireless and WAN monitoring: Offers stats for WiFi infrastructure and uses Cisco IPSLA to monitor WAN performance and outages
- Cisco ACI and storage monitoring: Provides visibility into Cisco ACI fabric, tenants, endpoint groups, and monitors storage arrays and tape libraries
- Distributed network visibility: Uses remote probes for multi-site monitoring with centralized control and location-specific performance data
Limitations (as reported by users on G2):
- Limited device support, particularly for Linux/Unix and in the free edition
- NetFlow monitoring is considered underpowered
- Poor customer support often requires multiple escalations
- Complex setup process with a steep learning curve
- Additional licensing for modules increases overall cost
- Interface lacks flexibility, and 2FA configuration can be problematic
- Integration with third-party tools and licensing processes is time-consuming

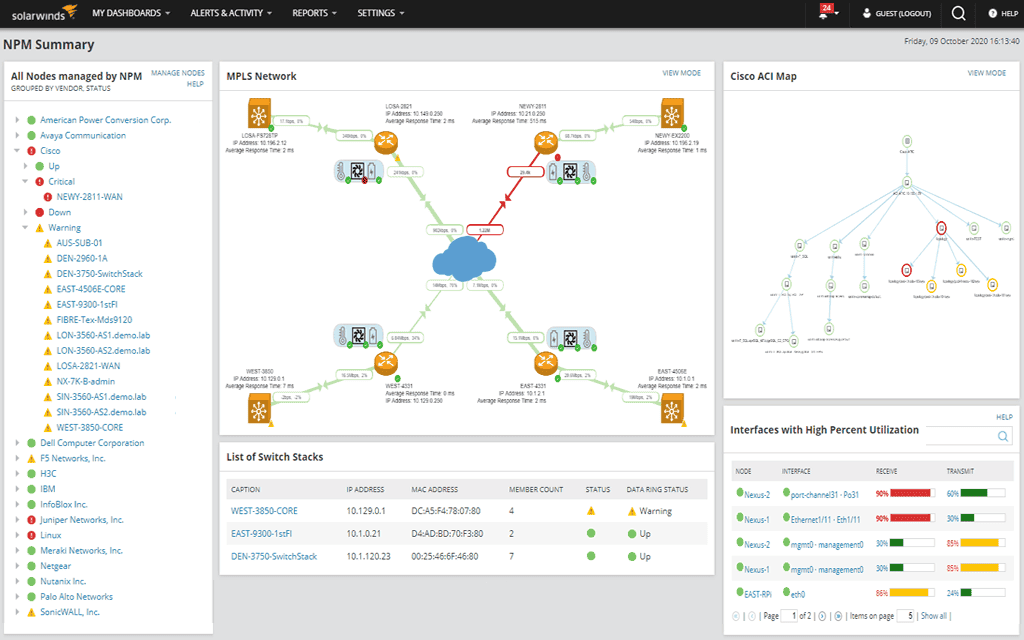
5. SolarWinds Network Performance Monitor
SolarWinds Network Performance Monitor (NPM), part of the SolarWinds Observability Self-Hosted platform, provides visibility into network performance and availability across hybrid, multi-vendor environments. NPM monitors network health, detects performance degradation, and helps teams resolve issues before they impact users.
Key features include:
- Hybrid network monitoring: Continuously monitors network performance across on-premises and hybrid infrastructures from a single interface
- NetPath™ visualization: Maps network paths to identify performance bottlenecks and pinpoint root causes
- Intelligent network mapping: Automatically generates maps of network topology, simplifying infrastructure management and troubleshooting
- PerfStack™ analysis: Correlates network metrics for performance analysis and faster diagnostics
- Alerting: Uses anomaly detection and AIOps-based alerts to provide notifications of potential issues
Limitations:
- No support for inbound messages from Slack
- Does not support route analytics or flow correlation
- No native log pattern mining or advanced metadata enrichment
- Lacks natural language query interface; uses structured query syntax
- Uses rigid data models, limiting flexibility in heterogeneous environments
- Dashboards lack unified real-time analytics views

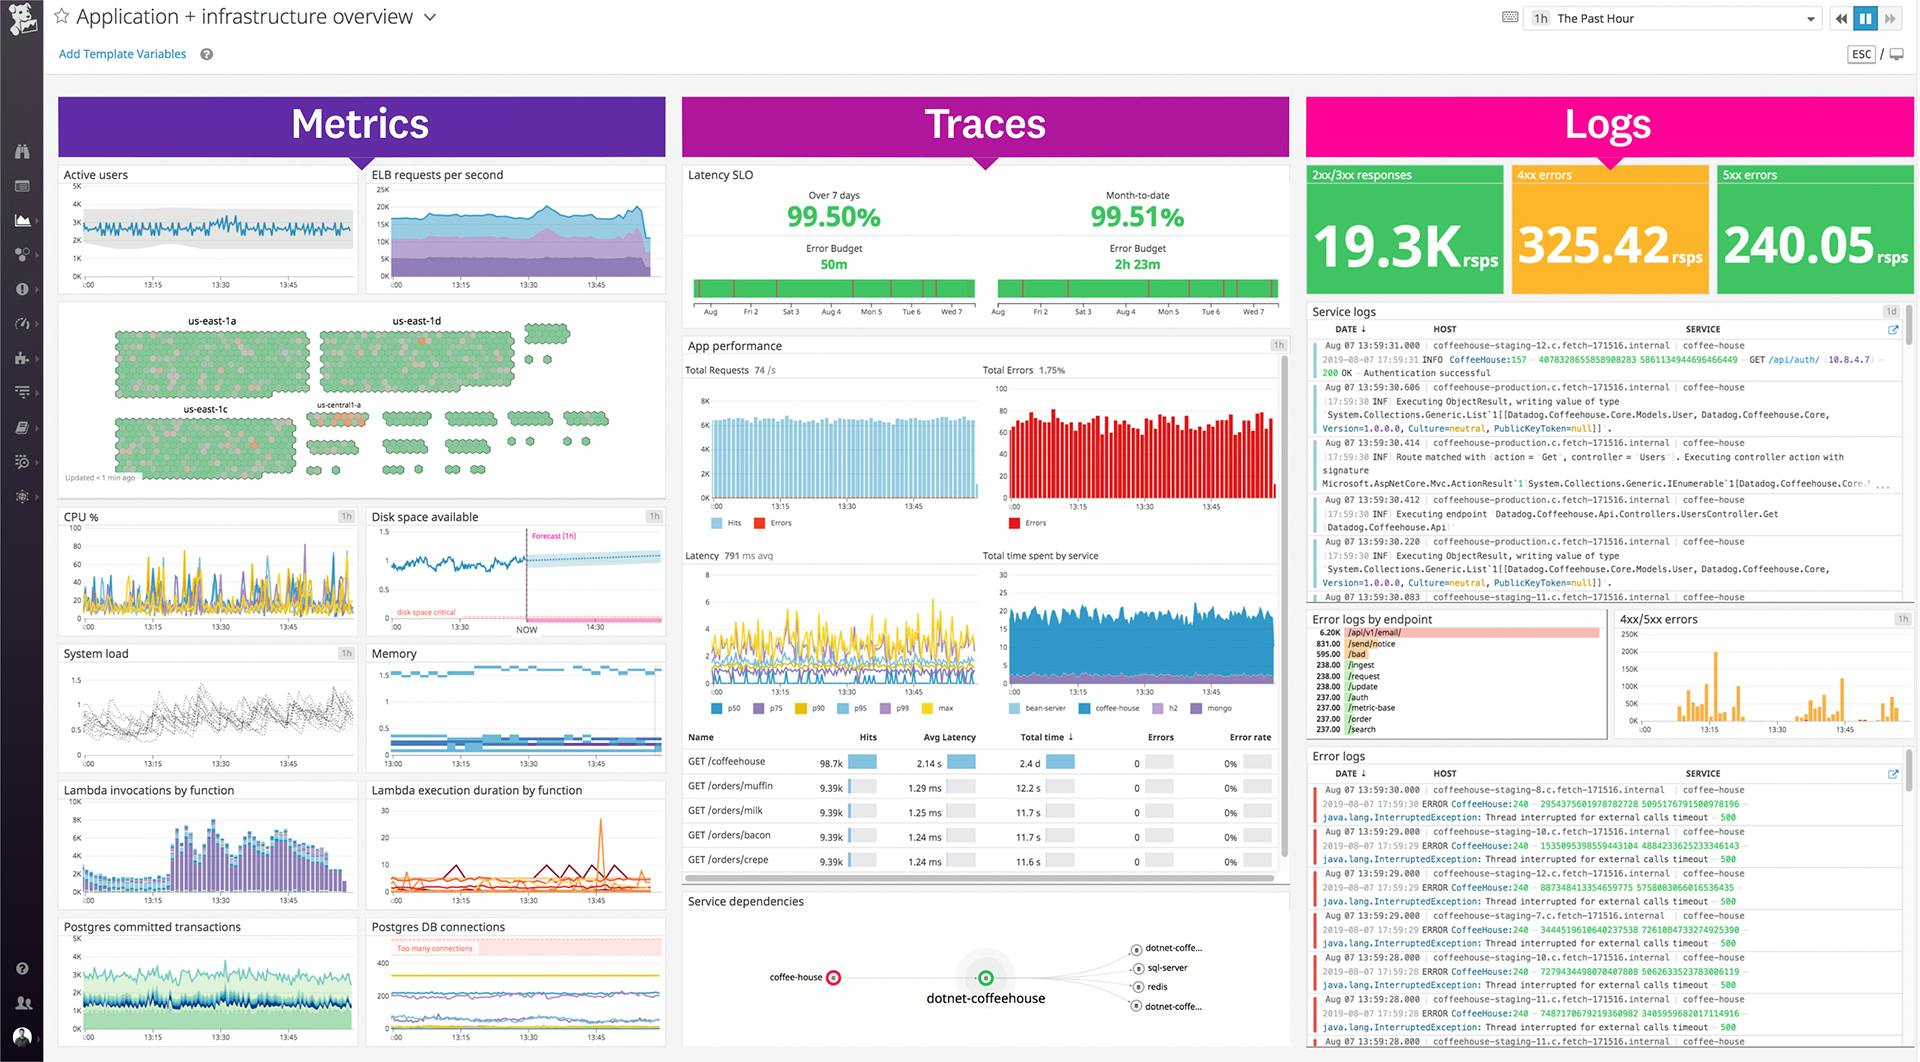
6. Datadog
Datadog Network Monitoring provides visibility across cloud, hybrid, and on-premises environments by correlating network, infrastructure, and application data. Designed for distributed systems, it helps teams trace connectivity issues, identify performance bottlenecks, and accelerate incident resolution.
Key features include:
- Unified network visibility: Consolidates network data from cloud, hybrid, and on-prem systems into a single view
- Cloud network monitoring (CNM): Tracks service-to-service traffic, identifies latency and packet loss, and correlates network behavior with infrastructure and application performance
- Network device monitoring (NDM): Monitors physical and virtual devices with broad vendor support and hop-level diagnostics across WANs and hybrid setups
- Traffic path visualization: Displays hop-by-hop traffic flows to pinpoint performance issues across cloud-native and physical networks
- Integrated monitoring: Enables pivoting between application, infrastructure, and network layers for faster root cause analysis
Limitations:
- Does not support log pattern mining or clustering
- Lacks advanced metadata enrichment for event correlation
- No route or flow analytics capabilities
- Does not correlate alerts with maintenance windows
- No support for configuration change diff analysis
- Lacks capacity planning or forecasting tools

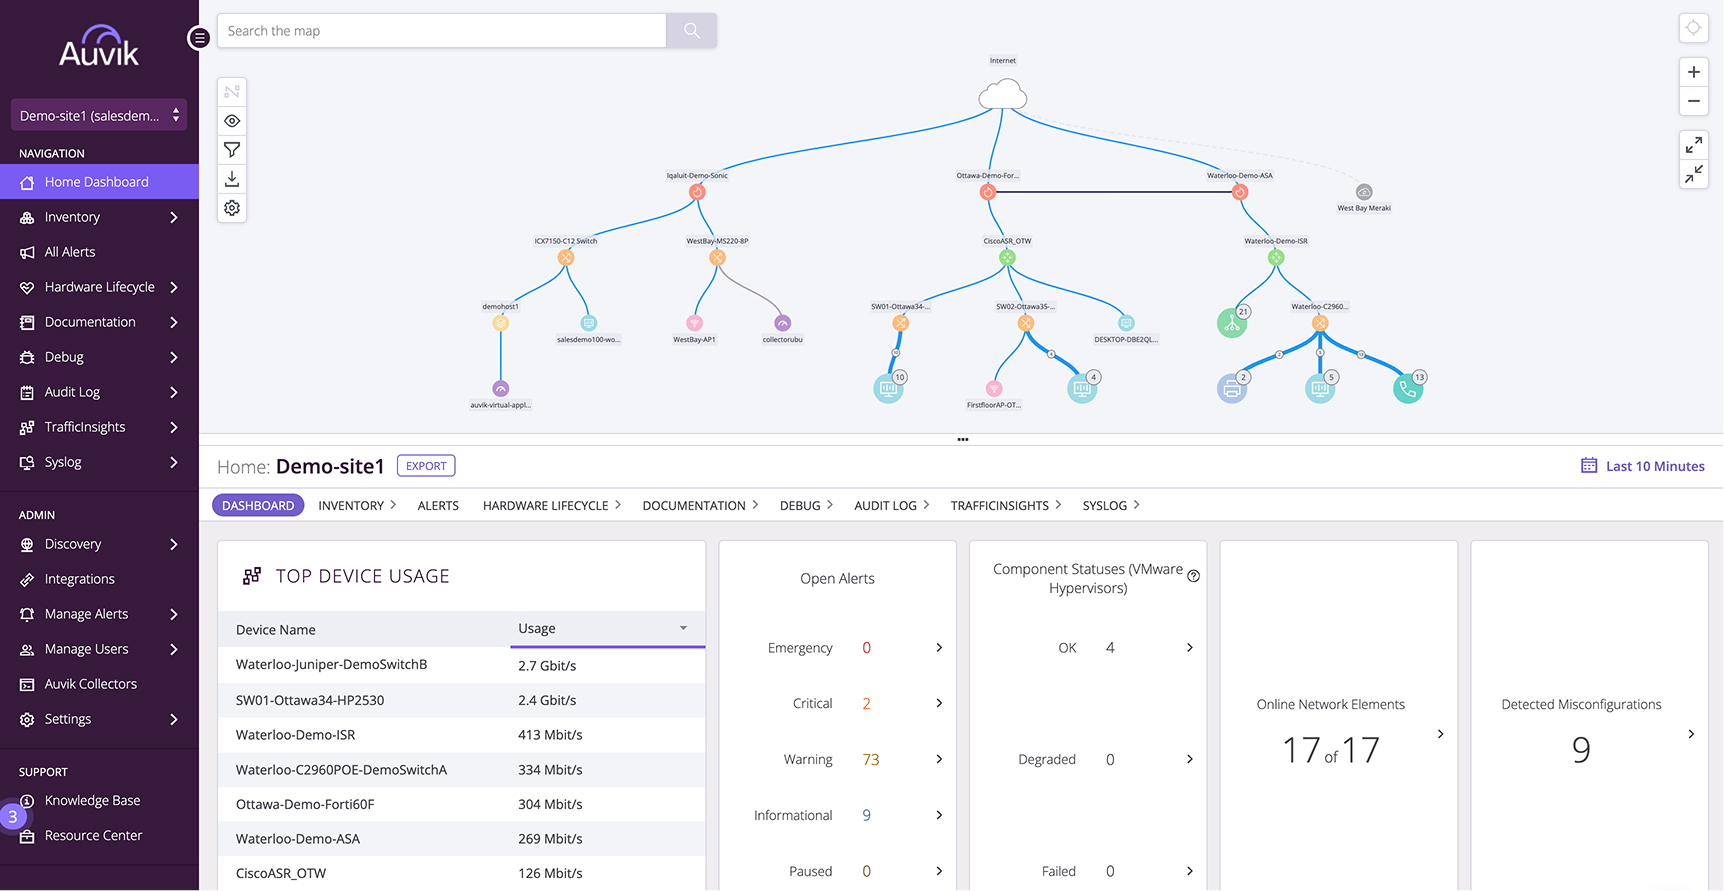
7. Auvik
Auvik is a cloud-based network monitoring and management platform that delivers visibility into devices, connections, and changes across a network. It auto-discovers network components and builds dynamic topology maps, eliminating the manual overhead of traditional tools. It supports over 700 device vendors, provides automated mapping, and offers live monitoring.
Key features include:
- Real-time monitoring: Provides live metrics and status updates for devices and traffic
- Automated network mapping: Continuously updates topology maps as the network changes, requiring no manual input
- Fast cloud-based deployment: Fully operational in under an hour with zero complex setup
- Multi-vendor support: Works out of the box with over 700 device vendors including switches, routers, firewalls, and controllers
- All-in-one management: Consolidates mapping, traffic analysis, config backups, and device inventory in a single tool
Limitations (as reported by users on G2):
- Device compatibility issues impact network mapping and documentation
- Limited customization and ineffective support reduce usability
- Initial setup is complex due to unclear instructions
- High cost may be prohibitive for smaller organizations
- Performance degrades in large networks
- Frequent alert noise and limited alert configuration options
- Confusing billing practices reported by users

8. WhatsUp Gold
WhatsUp Gold is a network monitoring platform that provides visibility into on-premises, cloud, and hybrid IT infrastructures. It combines discovery, mapping, real-time monitoring, and alerting in a single interface. WhatsUp Gold auto-discovers layer 2/3 network components and builds interactive topology maps that span physical, virtual, wireless, and cloud environments.
Key features include:
- Network monitoring: Covers on-prem, cloud, and hybrid resources, including routers, switches, servers, VMs, and wireless controllers
- Layer 2/3 network discovery: Automatically builds interactive topology maps that reflect infrastructure changes
- Alerting and dashboards: Provides customizable alerts and dashboards to help meet SLAs and reduce response times
- Integrated log management: Monitors syslogs and Windows logs, enabling search, filtering, alerting, and long-term archiving
- Network traffic analysis: Delivers live insights into bandwidth usage and traffic flows for faster diagnostics of bottlenecks
Limitations (as reported by users on G2):
- Licensing is expensive, particularly for larger environments
- Integration and setup are often complex and time-consuming
- Learning curve is steep, especially during initial configuration
- UI can be unintuitive, with limited dashboard customization
- Feature gaps include lack of hybrid monitoring and advanced user management
- Configuration issues affect accuracy, especially with specific device types like Fortinet
- Limited customization options restrict workflow optimization

How to Choose the Right Network Monitoring Software
Choosing the right network monitoring software requires aligning tool capabilities with your organization’s specific needs and infrastructure. Beyond headline features, several practical and technical considerations determine how effective and sustainable a solution will be in your environment.
Key considerations:
- Network size and complexity: Choose a solution that can handle your current network scale and projected growth. Smaller environments may benefit from lightweight, all-in-one tools, while complex or distributed networks may require scalable platforms with support for multi-site deployments and data aggregation.
- Protocol and vendor compatibility: Ensure the software supports the protocols and hardware used in your network, including SNMP, NetFlow, and proprietary APIs. Broad vendor support is critical if you operate a heterogeneous environment with equipment from multiple manufacturers.
- Deployment model (on-prem vs. cloud): Evaluate whether an on-premises or cloud-based solution aligns better with your infrastructure, compliance requirements, and staffing resources. Cloud options reduce infrastructure overhead but may introduce data privacy concerns in regulated industries.
- Customization and extensibility: Look for platforms that let you customize dashboards, alerts, and reports. Extensibility through APIs, scripting, or plugin ecosystems enables integration with other IT systems and adapts the tool to unique operational workflows.
- Ease of use and setup time: Consider how quickly the tool can be deployed and whether it requires specialized expertise to operate. Tools with automated discovery, prebuilt templates, and intuitive interfaces minimize ramp-up time and training needs.
- Alert accuracy and noise reduction: Select a tool that offers intelligent alerting with support for thresholds, baselining, and suppression. Poorly tuned alerts can overwhelm teams and hide real issues, while accurate alerts improve response times and focus efforts.
- Support and community ecosystem: Assess the quality of vendor support, documentation, and community forums. Strong support channels can accelerate troubleshooting, while active user communities contribute scripts, templates, and best practices.
- Security and compliance features: Ensure the platform adheres to security best practices, such as role-based access control, encryption, and audit logging. Compliance features, such as change tracking and data retention settings, may be mandatory in regulated environments.
Conclusion
Choosing a network monitoring solution involves balancing visibility, scalability, and automation to support modern infrastructure. The ideal software offers real-time insights, reduces manual effort, and integrates seamlessly with broader IT workflows. Prioritizing compatibility, usability, and data-driven decision support helps ensure the solution remains effective as the network evolves.
Learn more about how Selector’s AIOps platform can transform your IT operations.
To stay up-to-date with the latest news and blog posts from Selector, follow us on LinkedIn or X and subscribe to our YouTube channel.