What Are Network Monitoring Tools?
Network monitoring tools are software systems that continuously observe, analyze, and report on the health and performance of IT networks. Their primary role is to help network administrators and engineers maintain network operations, minimize downtime, and quickly identify or resolve potential issues.
These tools work by collecting data from various network devices such as routers, switches, servers, and endpoints using standards like SNMP, NetFlow, or proprietary protocols.
The collected data is then analyzed to highlight areas of concern like bandwidth bottlenecks, packet loss, latency, or device failures. By providing clear insights into network topologies and performance trends, these tools enable organizations to stay proactive about managing their infrastructure.
Key Components and Features of Modern Network Monitoring Tools
Network monitoring tools typically include the following capabilities.
Real-Time Performance Metrics
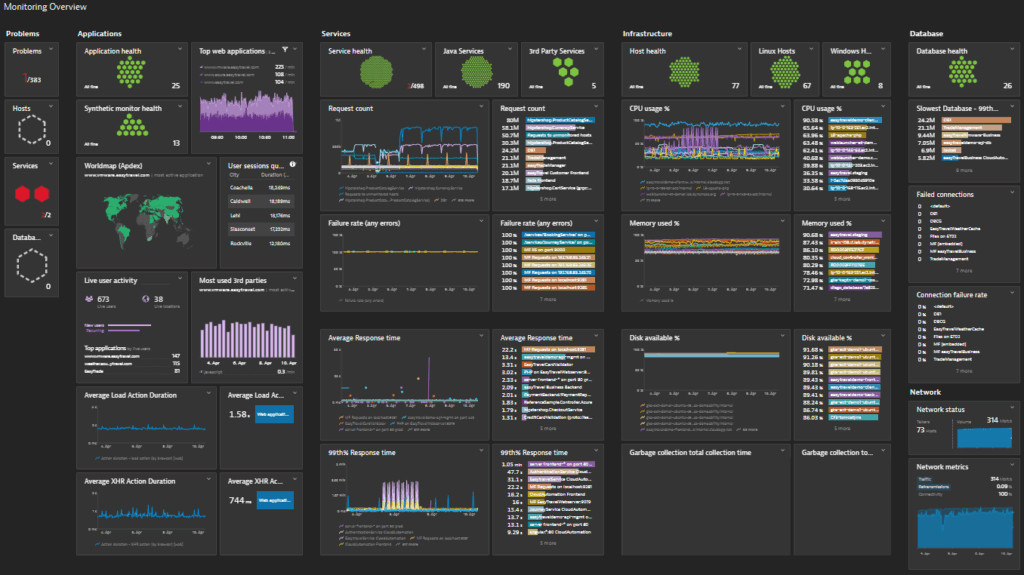
Modern network monitoring tools provide real-time visibility into network operations, capturing metrics such as latency, packet loss, bandwidth utilization, and CPU loads instantly. Real-time monitoring means anomalies or failures can be detected as they happen, reducing the mean time to resolution. The interface typically presents these metrics through live charts and dashboards, supporting quick diagnosis.
Continuous real-time monitoring also helps track fluctuations under normal or peak conditions. Administrators can identify patterns, such as daily spikes in bandwidth or persistent latency during critical business hours. This enables rapid troubleshooting and root cause identification.
Automated Discovery and Mapping
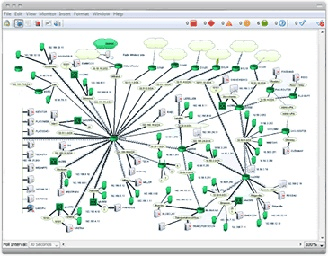
Automated discovery is a core feature that enables the tool to scan the network and identify connected devices without manual input. This process rapidly catalogs network assets like switches, routers, firewalls, and endpoints, mapping their interconnections and dependencies. Visual maps generated by these tools provide a topological overview, greatly simplifying network management.
Network topologies can be complex and dynamic, especially in modern hybrid or virtualized environments. Automated mapping adapts to changes such as device additions, removals, or reconfiguration. Accurate maps minimize blind spots and enable teams to keep documentation up to date.
Intelligent Alerting and Thresholds
Intelligent alerting capabilities underpin the effectiveness of monitoring tools. Administrators can define thresholds for key metrics, such as CPU utilization or bandwidth consumption, triggering alerts when those boundaries are breached. These alerts are delivered via email, SMS, or integrated ticketing systems, ensuring issues are escalated to the right teams promptly.
Modern tools also feature dynamic thresholds, adapting baseline alerts by learning network behavior over time and reducing false positives. Context-aware alerting, such as correlating events across devices or factoring in maintenance windows, further improves notification accuracy.
Historical Reporting and Dashboards
Historical reporting allows administrators to review past performance trends, outages, and recurring issues. Network monitoring tools archive metrics and events over time, enabling deep-dive analysis of factors contributing to incidents or suboptimal performance. Query and reporting features help meet compliance requirements and support capacity planning.
Dashboards synthesize both real-time and historical data into visual representations. Customizable widgets, heatmaps, and charts offer stakeholders at-a-glance insights suitable for tactical troubleshooting or strategic reviews. This consolidated reporting also assists in demonstrating service-level agreement adherence.
Multi-Environment Integrations
As enterprises adopt hybrid, cloud, and multi-site architectures, network monitoring tools must integrate across varied environments. Modern solutions support data center hardware, SD-WAN deployments, virtualized platforms, and cloud services (such as AWS, Azure, or Google Cloud). This ensures comprehensive oversight across the entire IT estate.
Integrations also extend into third-party ticketing, automation, and collaboration platforms, simplifying incident workflows and cross-team coordination. Through APIs and connectors, monitoring tools synchronize context between network domains, enabling faster troubleshooting and unified management.
Notable Network Monitoring Tools
1. Selector
Selector is an AI-powered network observability and AIOps platform designed to help enterprises monitor, correlate, and resolve performance issues across complex, multi-domain environments. Unlike traditional network monitoring tools that rely solely on static thresholds and device-level polling, Selector ingests and harmonizes diverse telemetry — including metrics, logs, events, flows, and streaming telemetry — into a unified data model for advanced analytics.
Key features include:
- Comprehensive data ingestion: Supports SNMP, NetFlow, gNMI, syslog, OpenTelemetry, and API integrations to deliver unified visibility across networks, cloud, and infrastructure domains.
- Real-time correlation and root cause analysis: Automatically correlates alerts, anomalies, and events across multiple layers (network, application, and infrastructure) to identify root causes faster and reduce mean time to resolution (MTTR).
- AI-driven insights and Copilot interface: Selector’s Network LLM and Copilot allow engineers to interact with their network using natural language, accelerating troubleshooting and enhancing collaboration between teams.
- Digital Twin and replay capabilities: Creates a continuously updated model of the entire environment, enabling “DVR-style” playback of historical states for deep forensic investigation and capacity planning.
- Scalable multi-environment visibility: Provides full-stack observability across hybrid and distributed infrastructures — from data centers to cloud and edge — through a single, AI-assisted interface.
Selector’s data-centric approach ensures that monitoring insights are trustworthy and contextually relevant. By prioritizing data quality and correlation, Selector transforms network monitoring into a proactive, AI-assisted discipline that delivers faster insights, reduced alert noise, and improved service reliability.

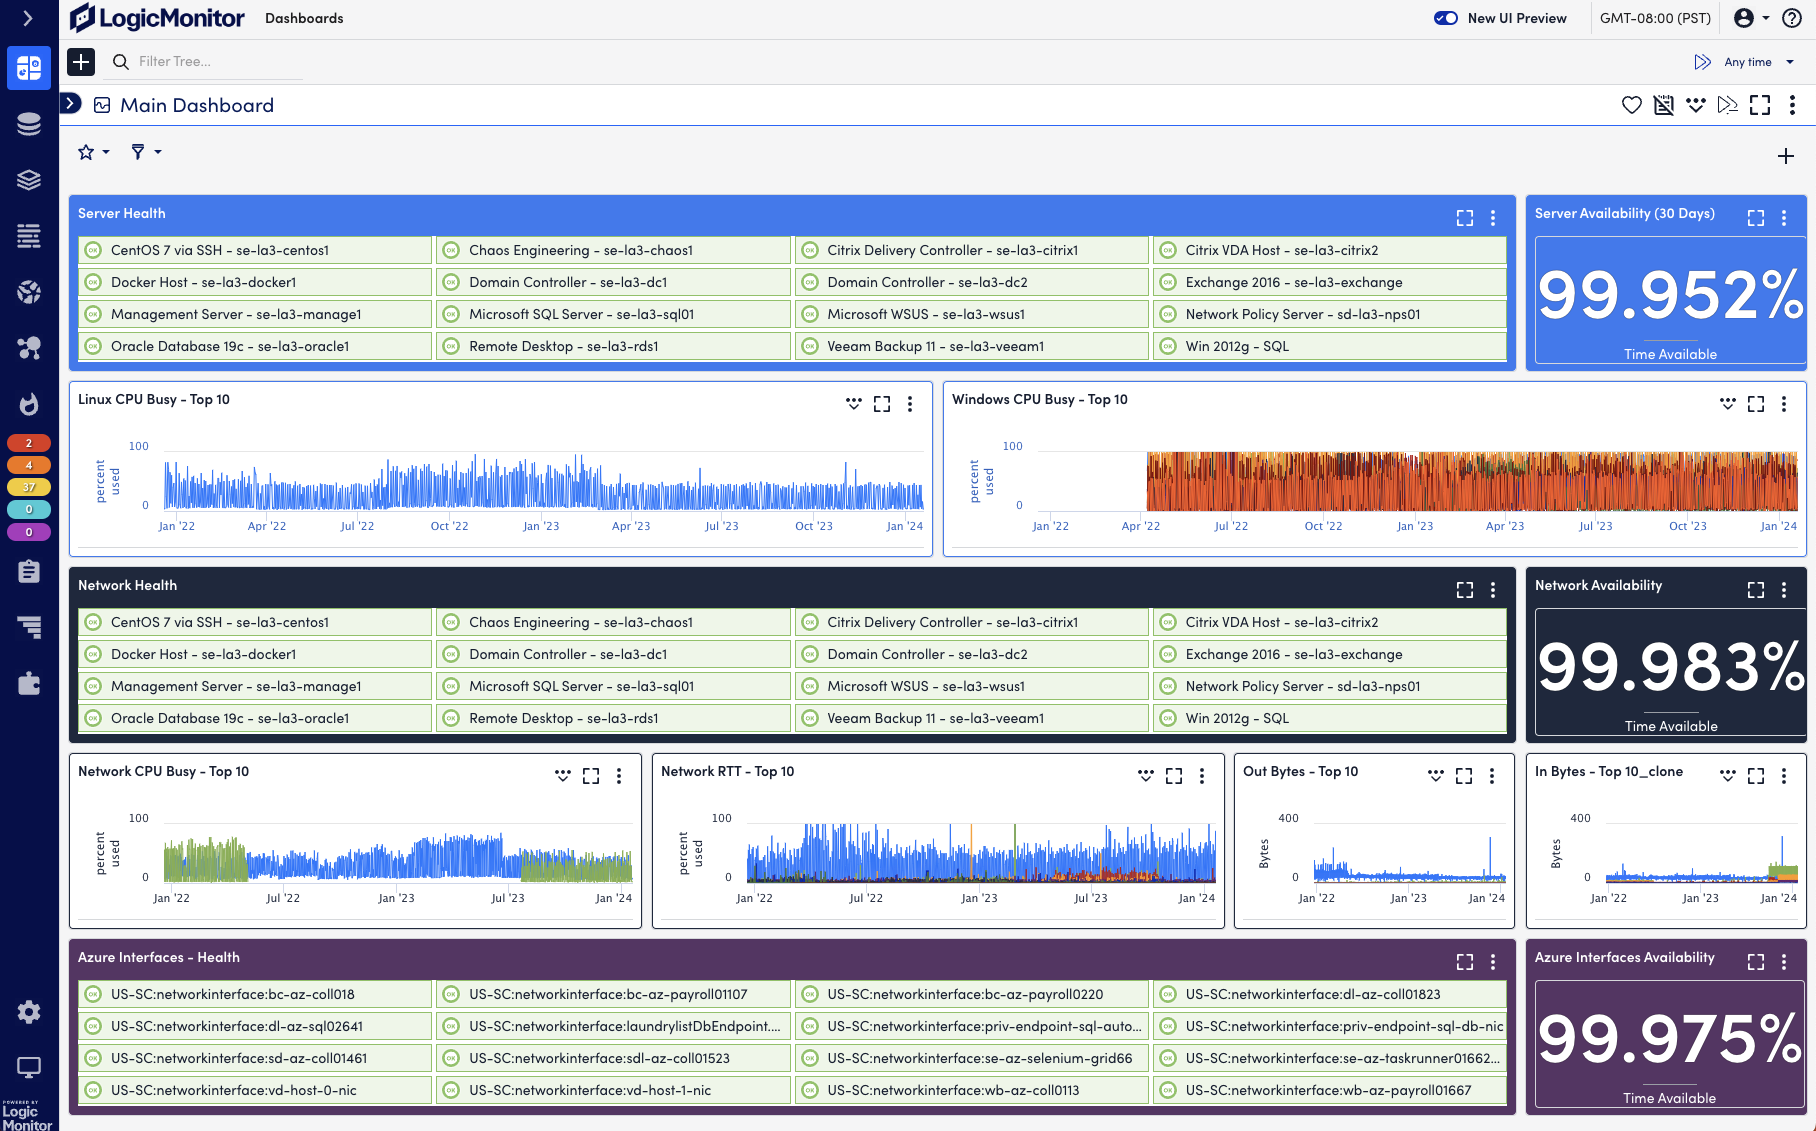
2. LogicMonitor
LogicMonitor is a unified observability platform that provides visibility across hybrid network environments, including cloud, on-premises, and edge infrastructure. Its core offering, LM Envision, combines performance monitoring, automated device discovery, and AI-powered alert correlation to help teams detect and resolve issues before users are affected.
Key features include:
- Monitoring: Collects performance metrics every 30 seconds using SNMP, WMI, and APIs to track latency, CPU, bandwidth, and interface health across devices.
- Automated discovery and mapping: Automatically scans networks on a schedule to detect routers, switches, and firewalls, and generates Layer 3 topology maps.
- Flow-level traffic analysis: Monitors application and protocol-level traffic to identify top bandwidth consumers, using NetFlow analytics without needing third-party tools.
- Anomaly detection and predictive alerts: Uses machine learning to forecast issues and route alerts with context to the appropriate teams.
- Custom dashboards and reports: Builds role-specific dashboards for NOC teams, executives, or clients, and automates recurring performance reports.

3. Datadog
Datadog offers a network monitoring solution that provides visibility across cloud-native, hybrid, and on-premises infrastructure. Its platform combines cloud network monitoring and network device monitoring to trace traffic paths, correlate infrastructure data, and identify root causes.
Key features include:
- Unified view across environments: Consolidates monitoring across cloud, hybrid, and on-prem setups, enabling correlation between applications, infrastructure, and network layers.
- Cloud network monitoring (CNM): Tracks inter-service communication and hop-by-hop traffic flow across containers, cloud-native services, and third-party endpoints.
- Network device monitoring (NDM): Monitors physical and virtual devices across WAN and hybrid networks, correlating device health with NetFlow data.
- Traffic path visualization: Visualizes traffic routes with intermediate hop metrics like latency and packet loss, helping teams pinpoint failures across distributed systems.
- Integrated troubleshooting: Enables pivoting between application-level performance and underlying device traffic.

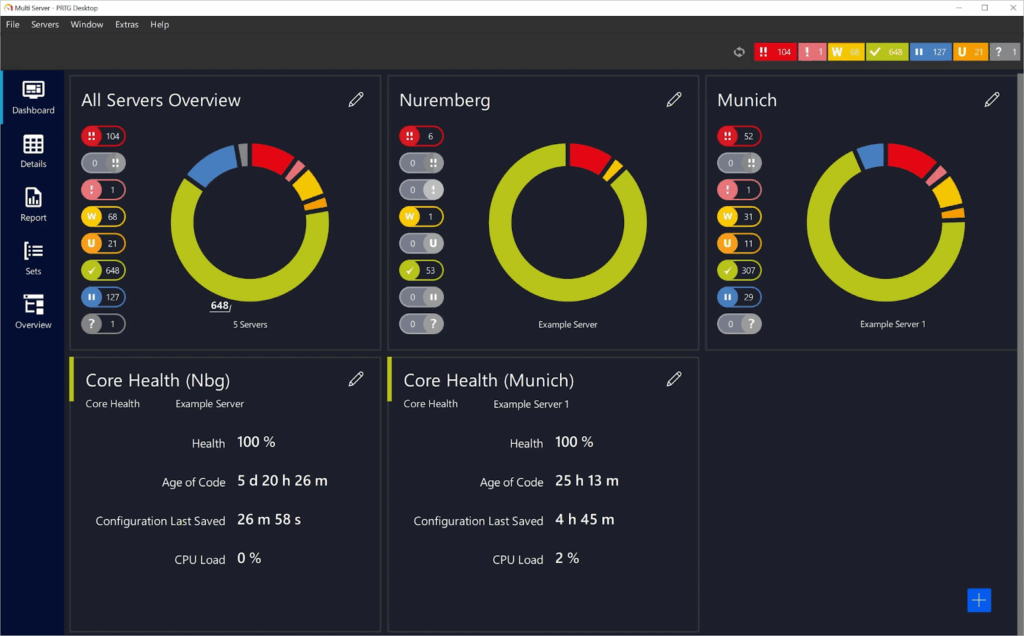
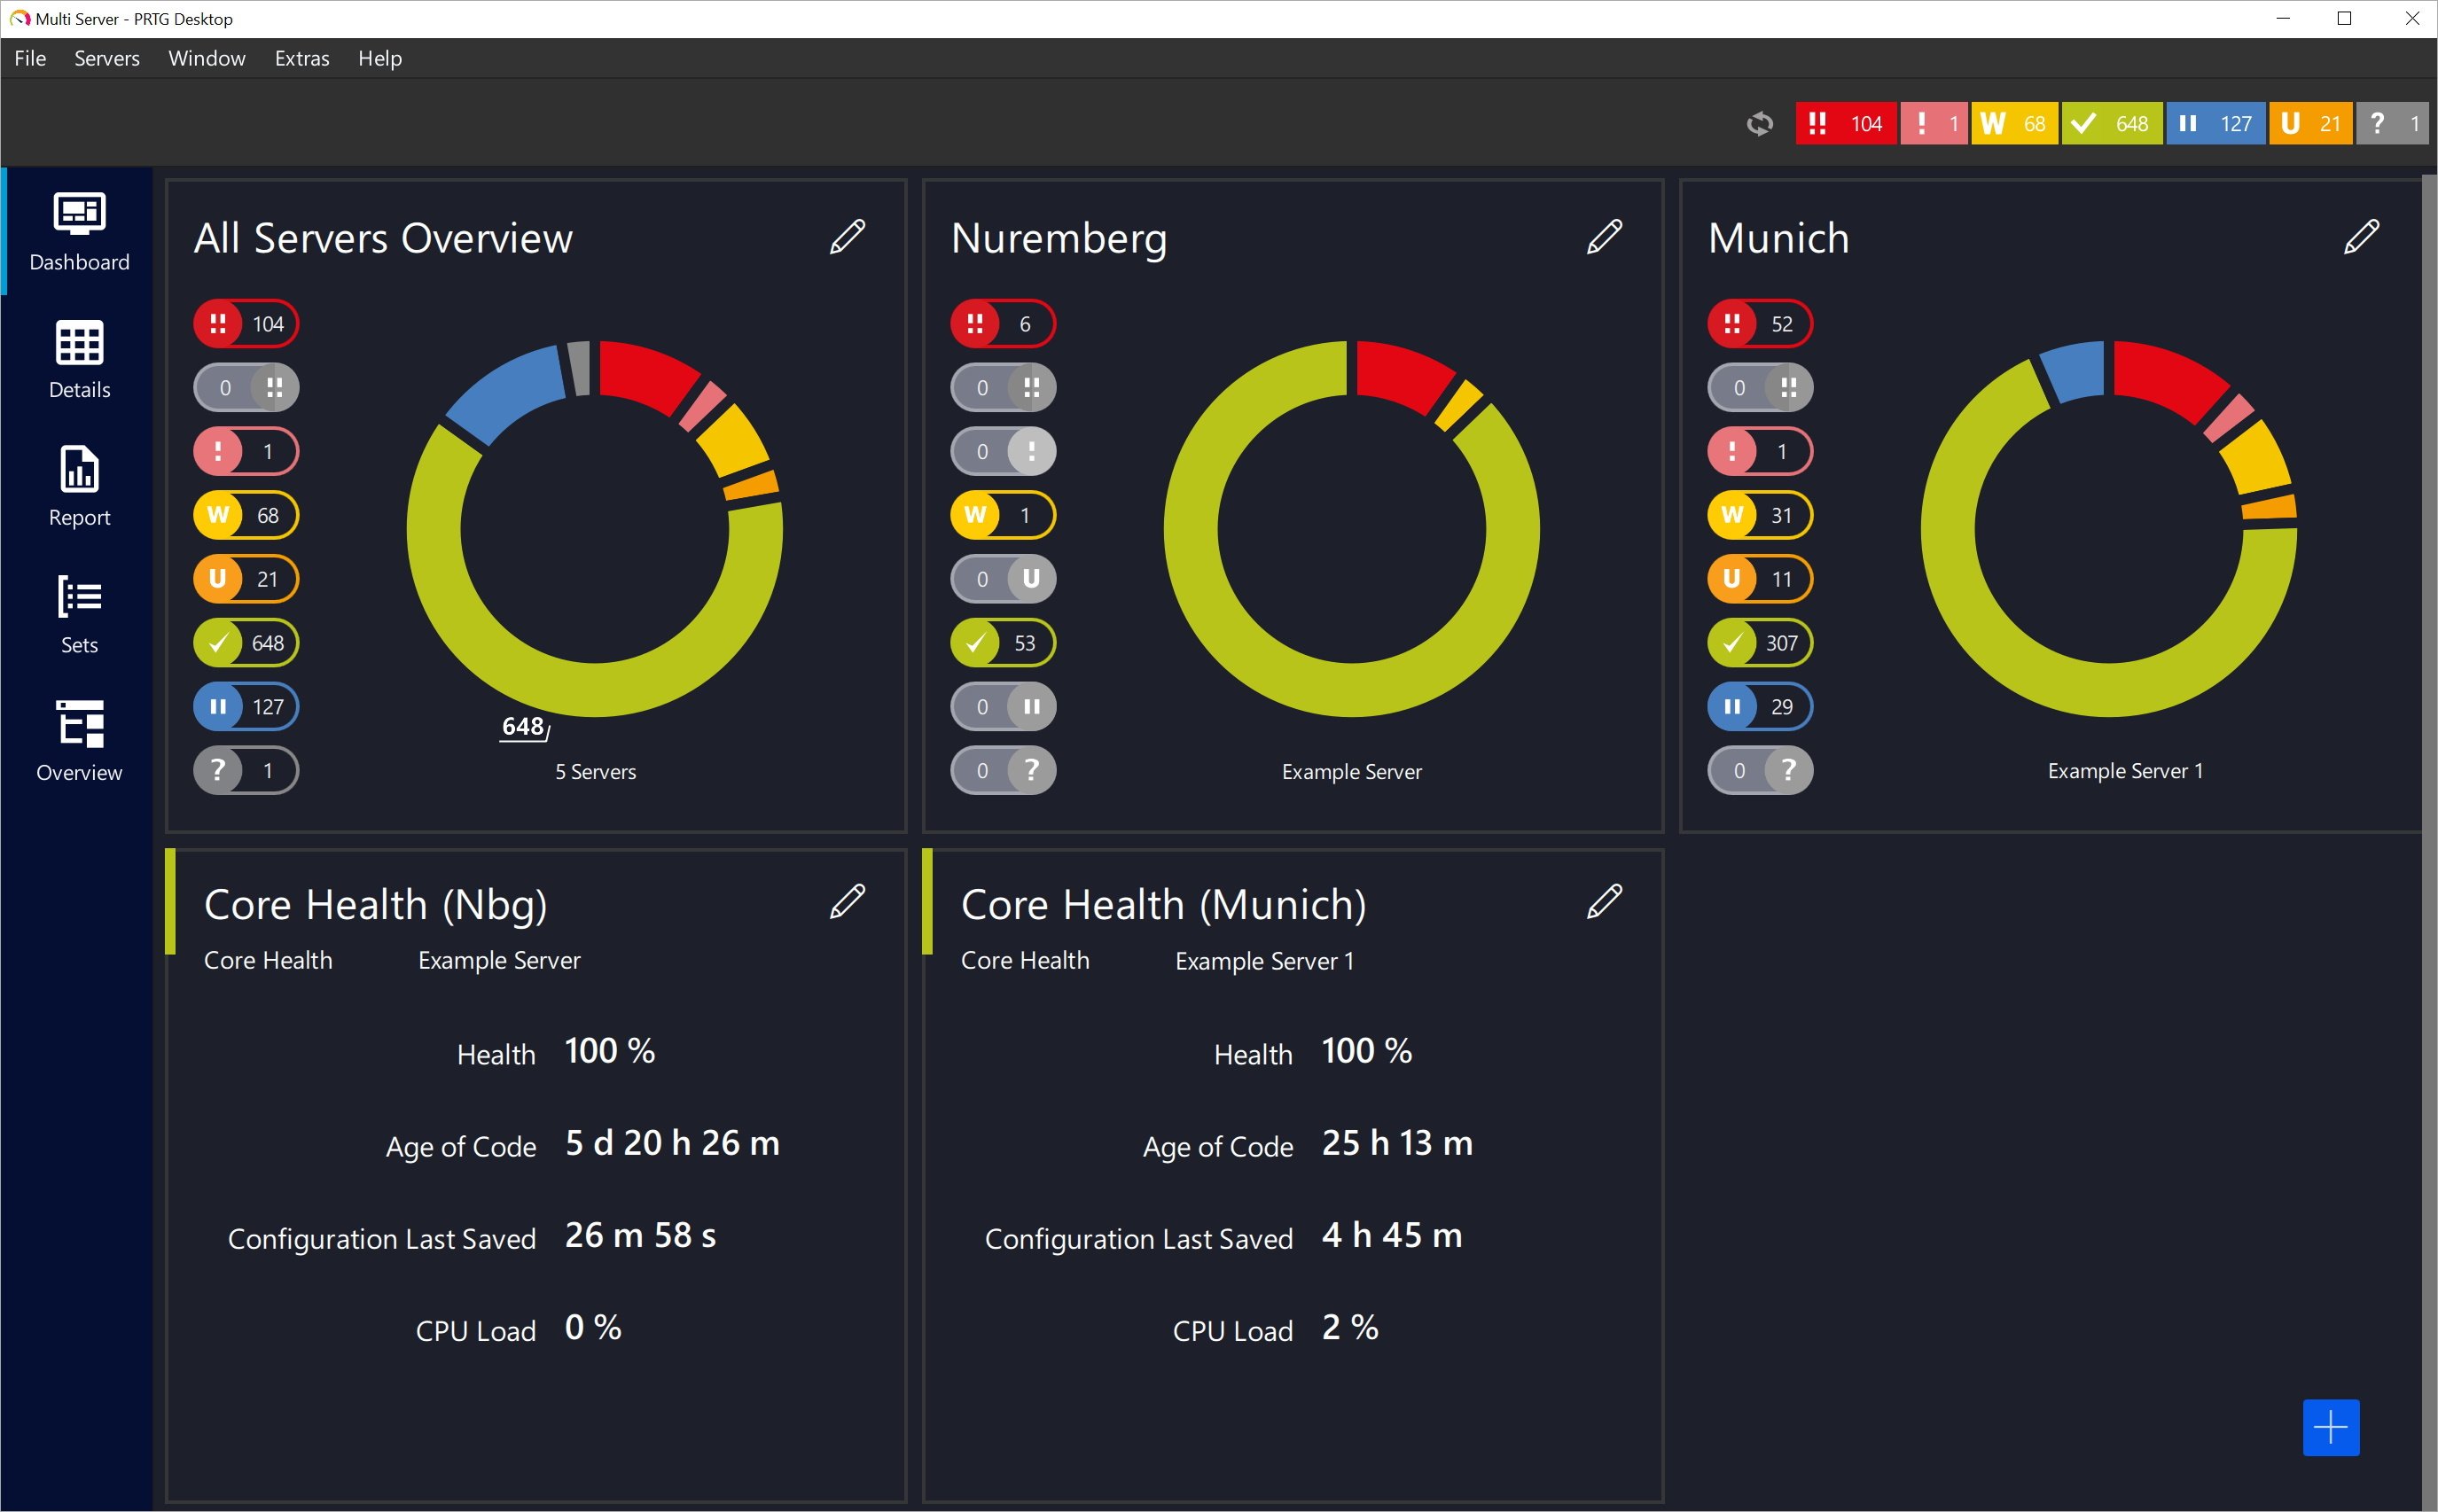
4. Paessler PRTG
Paessler PRTG is a network monitoring solution that gives IT teams visibility into their infrastructure, from devices and applications to traffic and cloud services. It offers a sensor-based approach that allows users to tailor monitoring across networks, servers, and databases.
Key features include:
- Infrastructure monitoring: Supports monitoring of networks, servers, cloud services, databases, and applications using customizable sensors.
- Network visibility: Tracks uptime, traffic, and performance metrics across LAN components like routers, switches, printers, and workstations, as well as internet-facing services.
- Protocol support: Uses SNMP, flow protocols, WMI, ping, SQL queries, and other methods to monitor devices and services across environments.
- Custom dashboards and live maps: Includes a map designer to build visualizations of infrastructure.
- Multi-platform access: Offers web, desktop, and mobile apps for monitoring and managing infrastructure.
5. Dynatrace
Dynatrace offers process-level network monitoring that goes beyond traditional host-based visibility to provide insights into communications between services across virtualized, cloud-native, and on-premises environments. Intended for dynamic infrastructure, it automatically discovers new components and tracks inbound and outbound traffic per process.
Key features include:
- Process-level traffic monitoring: Tracks requests, retransmissions, and bandwidth usage per process to pinpoint performance issues and identify resource-heavy services.
- Service-to-service communication visibility: Monitors and maps network communications between processes, helping teams detect connection failures and performance degradation across distributed environments.
- Dynamic network topology mapping: Automatically discovers virtual machines, cloud instances, and network interfaces, visualizing their connections and dependencies.
- Integrated health metrics: Combines network monitoring with resource data like CPU, memory, and disk.
- Full-stack correlation: Links network behavior with application and infrastructure performance.
6. Intermapper
Intermapper is a network monitoring solution that provides visibility and control across distributed IT environments. With auto-generated maps, customizable visual layouts, and alerting, it helps IT teams identify issues early and resolve them quickly.
Key features include:
- Automated network mapping: Automatically discovers and documents IP-enabled devices on the network. Offers customizable map layouts with icons and sub-maps to represent areas like floors or departments.
- Live network visualization: Color-coded maps show the status of devices, interfaces, and applications.
- Monitoring and alerts: Uses SNMP and other protocols to poll device health continuously. Alerts notify teams via email, text, or sound when performance thresholds are breached.
- Cross-platform compatibility: Runs on Windows, macOS, and Linux, enabling consistent management and access across environments.
- Capacity planning tools: Provides historical data, strip charts, and trend reports to support network growth and traffic forecasting. 64-bit support enables monitoring of thousands of nodes from a single dashboard.
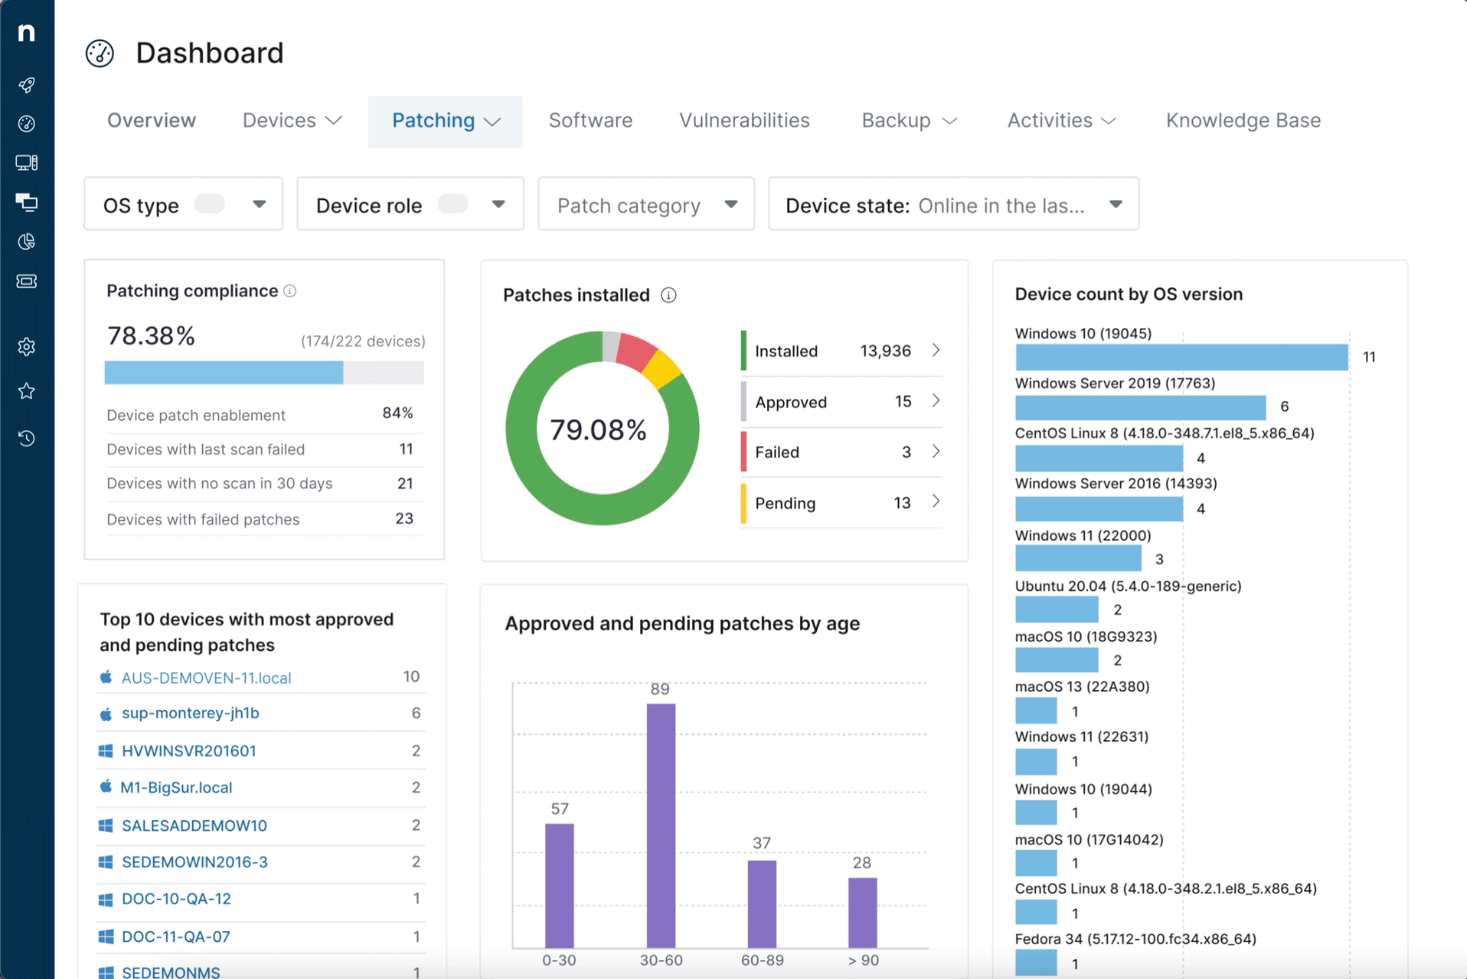
7. NinjaOne
NinjaOne delivers integrated network monitoring as part of its remote monitoring and management (RMM) platform. Built into the NinjaOne ecosystem, its network monitoring tools provide centralized visibility and insights into SNMP-enabled devices without the delays or complexity of third-party solutions.
Key features include:
- Unified SNMP monitoring: Offers single-pane visibility across routers, switches, firewalls, printers, and IoT devices.
- Device polling: Continuously polls SNMP devices for performance and status data, enabling detection of abnormalities like hardware failures or degraded connectivity.
- Custom OID monitoring: Includes over 50 OID templates for common devices (e.g., Dell iDRAC, HP iLO, Synology NAS), with customization for SNMP-enabled hardware.
- Granular alerting system: Supports hundreds of alert conditions. Alerts can be customized by type, severity, and delivery method (email or SMS).
- NetFlow traffic analysis: Integrated NetFlow support allows monitoring of top applications, users, endpoints, and conversations to isolate network bottlenecks.

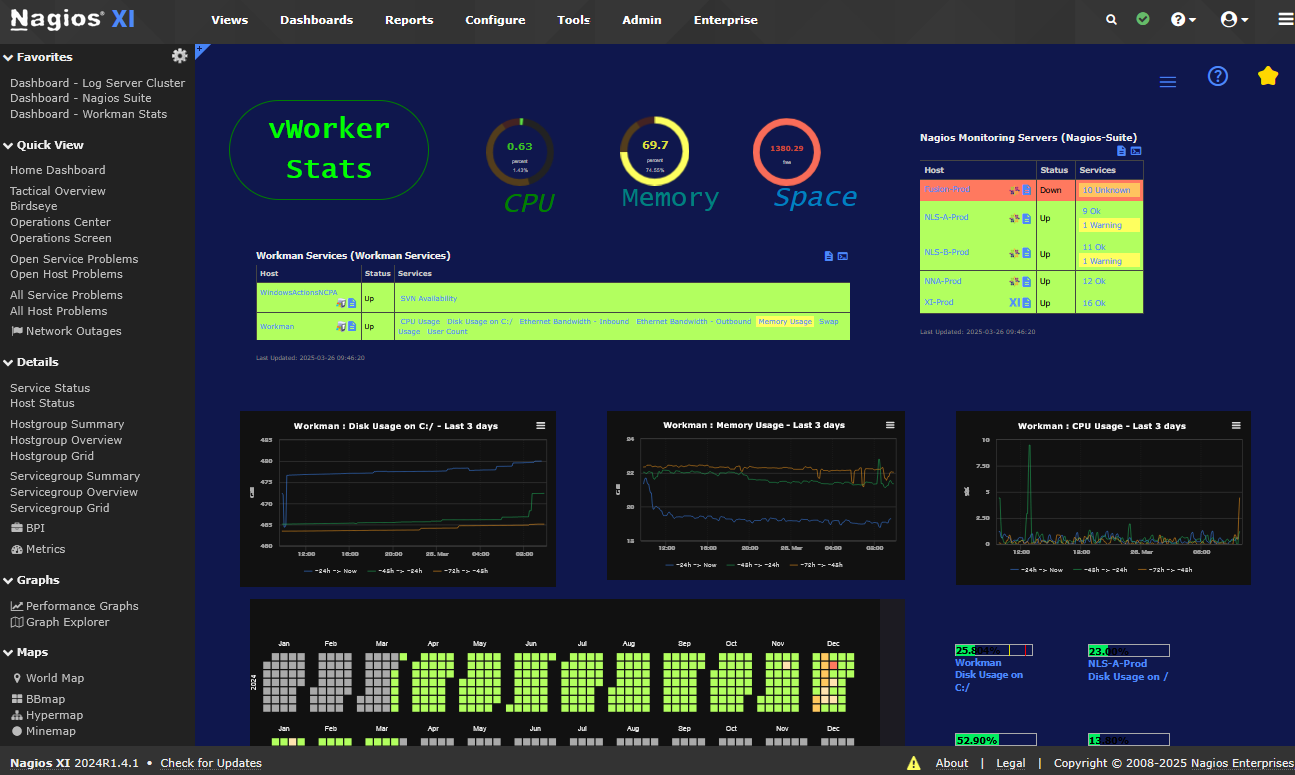
8. Nagios
Nagios is an open-source network and infrastructure monitoring solution that gives IT teams visibility into their environments. It provides monitoring for servers, network devices, services, and applications. It has a large plugin ecosystem and supports on-premises deployment.
Key features include:
- Network monitoring: Monitors network switches, routers, firewalls, ports, and connectivity using SNMP, active checks, and passive checks.
- Customizable open-source core: Built on the extensible Nagios Core engine, allowing control over what and how teams monitor.
- Thousands of plugins and extensions: Offers access to over 4,000 community-developed plugins via Nagios Exchange.
- Alerts and dashboards: Delivers notifications when issues are detected, with support for customizable thresholds and escalation. Visual dashboards and reports help teams track network health and historical trends.
- Auto-discovery: Detects and maps network infrastructure components, helping teams maintain a view of their environment as new devices are added.

Best Practices for Using Network Monitoring Tools
Organizations should consider these best practices when working with network monitoring tools.
1. Defining Proper Alerting Policies
Creating effective alerting policies starts by identifying which events require action and setting precise thresholds for each monitored metric. Policies should avoid both under-alerting, which leads to missed incidents, and over-alerting, which causes noise and fatigue among responding teams. Balance is achieved by understanding normal network baselines and defining what constitutes meaningful deviation due to failures, congestion, or security threats.
Alert escalation rules and prioritization further refine notification workflows. Different events require different responses: for example, critical device failures might warrant immediate paging, while minor bandwidth spikes could trigger routine review.
2. Regular Auditing of Device Configurations
Networks are dynamic and device configurations constantly evolve. Regularly auditing router, switch, and firewall configurations is necessary to detect unauthorized changes, misconfigurations, or policy drift. This process establishes a secure and reliable baseline for troubleshooting and compliance, ensuring documented changes match real-world settings.
Auditing also helps identify vulnerabilities such as legacy protocols, weak passwords, or unpatched firmware that could expose the organization to risk. Many monitoring tools offer configuration backup and comparison features, simplifying regular reviews.
3. Proactive Capacity Planning with Historical Data
Historical usage data is invaluable for forecasting future network growth and identifying capacity constraints before they cause performance degradation. By analyzing trends on bandwidth consumption, device uptimes, and peak activity patterns, administrators can justify upgrades, balance workloads, and budget appropriately for new investments or scaling initiatives.
Effective capacity planning leverages not only long-term metrics but also short bursts of activity or recurring seasonal peaks. This enables teams to differentiate between transient spikes and sustained growth, ensuring infrastructure is neither overprovisioned nor stretched too thin.
4. Frequent Testing of Failover Systems
Failover testing is critical for verifying the reliability and performance of redundancy mechanisms, such as backup links, standby devices, or disaster recovery sites. Simulated failure scenarios, whether scheduled or spontaneous, validate that automatic rerouting or failover triggers as designed, and that staff are prepared to respond under pressure.
Though monitoring tools can flag hardware health or link usage, only direct failover exercise proves operational readiness. Regular testing uncovers misconfigurations or overlooked single points of failure that could negate high availability strategies.
5. Maintaining Clear Network Documentation
Accurate network documentation, including diagrams, asset lists, configuration logs, and contact points, is vital for effective troubleshooting and continuity planning. Well-maintained documents allow engineers to trace dependencies, understand architecture, and onboard new staff rapidly. Monitoring tools that auto-generate topology maps and maintain device inventories can simplify this process.
Documentation should be updated as changes occur, such as device upgrades, new deployments, or policy adjustments. Accessible and regularly reviewed records ensure quick responses during incidents and support compliance audits.
Conclusion
Network monitoring tools play a central role in keeping IT environments reliable, secure, and scalable. They provide real-time visibility, automate discovery, and offer historical insights that support both troubleshooting and long-term planning. When properly implemented with clear alerting policies, documentation practices, and capacity planning, these tools transform network management from a reactive task into a proactive discipline that reduces risk and improves service delivery.
Learn more about how Selector’s AIOps platform can transform your IT operations.
To stay up-to-date with the latest news and blog posts from Selector, follow us on LinkedIn or X and subscribe to our YouTube channel.