AI for Network Leaders — Powered by Selector

Virtual sessions available on-demand now!

AI for Network Leaders — Powered by Selector

Virtual sessions available on-demand now!

On this page

Flexibility Without Friction: Custom Synthetics for Modern Monitoring

In today’s distributed systems, visibility isn’t optional — it’s critical. If a DNS resolution slows down, an API responds incorrectly, or a regional network segment drops packets, customers need to know immediately. Our Synthetics feature was built for that purpose: it runs a suite of predefined network probes (like ping and traceroute) and pushes the resulting metrics — latency, jitter, packet loss — into a metric store for monitoring and alerting.

That’s worked well for standard use cases. But over time, one thing became clear: customers needed more flexibility.

Suppose a customer wanted to check DNS latency to an internal domain, validate TLS handshakes, or simulate a multi-step API transaction. These types of checks didn’t fit into the fixed list of built-in probes. Supporting them meant updating the underlying agent — a process that’s slow, inflexible, and often out of sync with customer needs.

So we asked: What if customers could write and run their own probes — without needing to wait on us?

The What: Introducing Custom Synthetics

Custom Synthetics is a new capability that lets customers define their own network and service checks in Python, upload them to the platform, and have them run just like our built-in probes. The resulting metrics flow through the same telemetry pipeline and end up in the customer’s metric store, ready to be charted, queried, and alerted on.

This gives customers full control over what to measure, how to measure it, and what constitutes success or failure — all without needing to deploy a new agent version or submit a feature request.

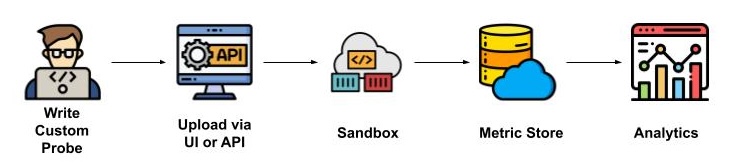
Here’s how it works in practice:

  • Customers write a Python script that performs a check — for example, making an HTTP request, resolving a domain, or verifying the response from a service.
  • They upload the script through our API or UI, along with any configuration like scheduling frequency or target endpoints.
  • The platform runs the code in a sandboxed environment on a regular schedule.
  • The script outputs metrics in a standard format.
  • The system collects and forwards those metrics to the customer’s metric store, where they behave like any other time series — ready for visualization and alerting.
Diagram showing how Custom Synthetics integrates user-defined Python probes into the Selector telemetry pipeline for monitoring and alerting.

This design means customers get the best of both worlds: the flexibility to define their own probes, and the reliability of a first-class monitoring pipeline.

How It Works: Behind the Scenes

The technical foundation of Custom Synthetics focuses on security, flexibility, and observability. Here’s a breakdown of the core architecture:

  • Execution sandbox: Each customer-defined probe runs in a restricted, containerized environment. The runtime enforces limits on memory, CPU, network access, and execution time to protect the platform and other workloads.
  • Simple authoring model: Probes are just Python scripts. There’s no DSL to learn or complex setup to manage. Customers bring their logic; we handle the rest.
  • Standardized output: The script emits structured results (metrics, tags, errors), which are automatically parsed and sent to the customer’s metric store.
  • Central scheduling and orchestration: Probes are scheduled and executed from a control plane, with logs and results captured centrally for debugging and observability.

This system lets customers move fast, experiment freely, and maintain visibility across increasingly complex networks and services — all without sacrificing control or safety.

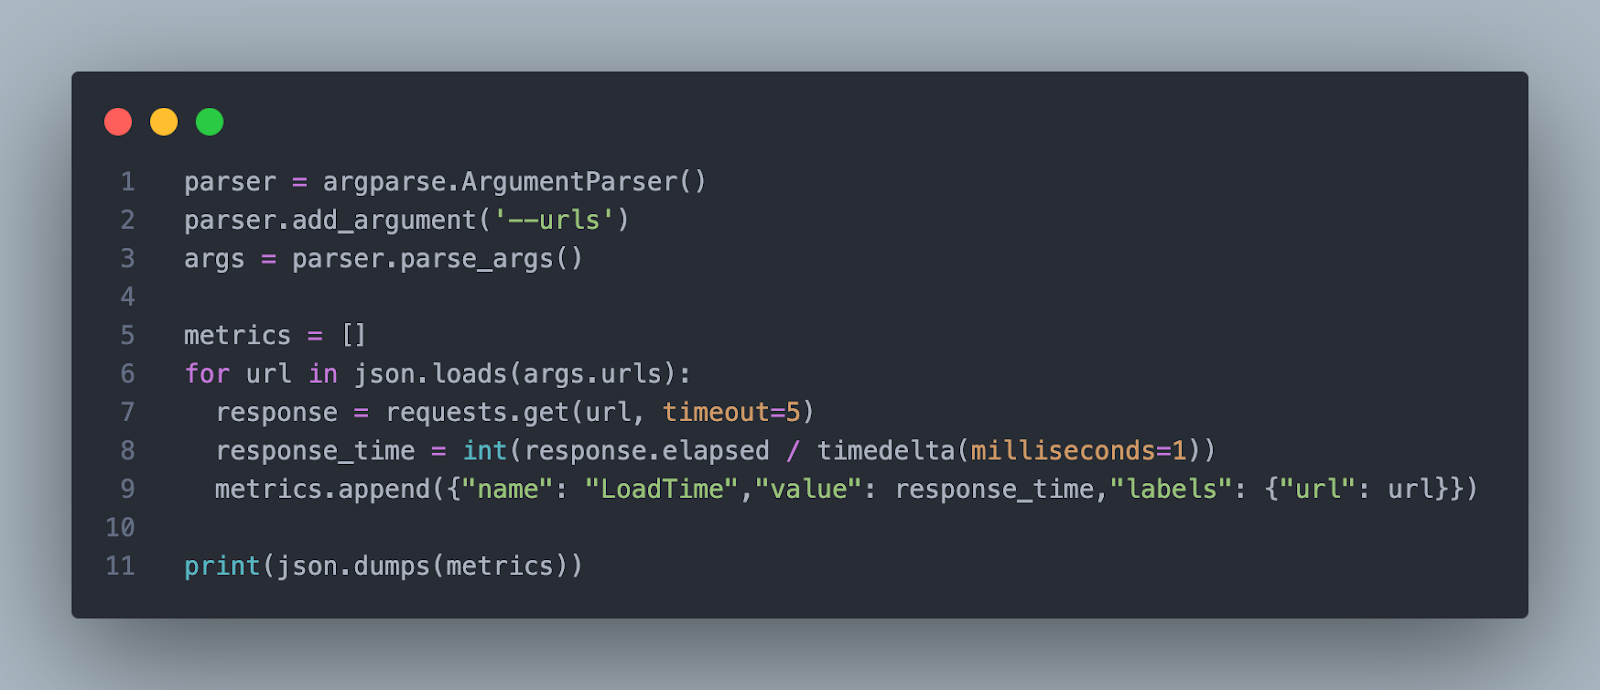
Sample Custom Synthetic Probe:

This probe takes in a list of URLs, and generates the LoadTime metric for each of those URLs.

Example Python script for a custom synthetic probe that measures load time across a list of URLs.

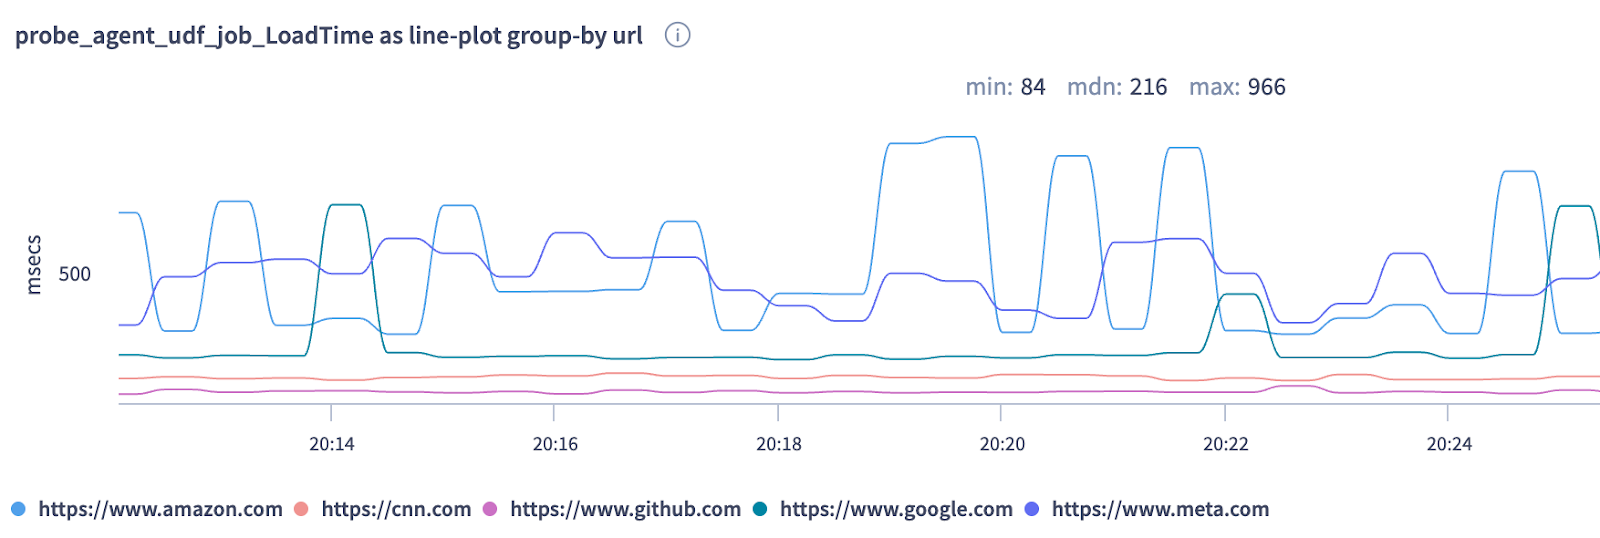
Once this probe is uploaded and attached to a compute resource along with the associated configuration parameters like the URL list, it will be executed at a certain interval and the metrics generated would be shipped to a metric store. One could then visualize these metrics on dashboards, or configure alerts and other workflows. Following is one such visualization where the above probe was configured with URLs www.amazon.com, cnn.com, github.com, google.com, and meta.com. Here we have load time for each of the URLs as a time-series.

Line chart visualizing load times for URLs including amazon.com, cnn.com, github.com, google.com, and meta.com using a custom synthetic probe.

Use Cases: Monitoring Without Limits

Here are just a few examples on how custom synthetics could be leveraged:

DNS Resolution Monitoring

Many customers manage private DNS zones or depend on third-party resolvers. A custom probe can resolve critical domains from different locations and emit latency and success/failure metrics, helping detect regional DNS degradation or failures.

Authenticated HTTP Checks

Built-in probes can’t always deal with real-world scenarios like token-based authentication or POST requests with payloads. With a custom probe, customers can simulate full API requests, validate response bodies, and verify SLA compliance with business-critical services.

TLS Handshake Timing

For services requiring secure connections, customers can create probes that measure the time it takes to complete a TLS handshake — a useful indicator of certificate issues or misconfigured CDNs.

Multi-Step Logic Checks

One could build a probe that performs a series of dependent API calls to simulate a full user journey — checking that the right objects are returned and that the data remains consistent across services. 

These kinds of probes are incredibly valuable — and until now, they required workarounds or custom tooling. With Custom Synthetics, they’re native and first-class. 

Why We Built It This Way

There were easier paths: we could have added more built-in probes, or created a limited DSL for customers to configure predefined actions. But we believe in building tools that scale with customer creativity, not limit it.

That’s why we chose Python — it’s accessible, expressive, and familiar to most engineers. Combined with strict sandboxing and a simplified output model, it lets customers go from idea to live metrics in minutes, without compromising system safety or observability.

From an engineering perspective, this meant investing in:

  • Safe execution environments that isolate customer workloads while preserving performance and reliability.
  • A unified telemetry pipeline that handles both built-in and custom probe outputs the same way.
  • Developer experience that balances power with guardrails, so teams can build quickly but safely.

Our goal wasn’t just to make probes extensible — it was to make extensibility feel native.

Observability on Your Terms

Custom Synthetics unlocks a new level of control in monitoring setups. No more waiting for platform updates. No more hacking together one-off tools. Now, when customers need to observe something specific — whether it’s a DNS resolver, a slow API, or a flaky external dependency — they can write a probe and ship it themselves.

All the heavy lifting is handled by the platform. Customers write the logic, we run it securely, and the metrics show up exactly where they should — ready to power alerts, dashboards, and decisions.

Whether you’re a platform team enforcing SLAs, a network engineer debugging regional anomalies, or an application developer catching regressions before your users do, Custom Synthetics gives customers the flexibility they need — without the friction.

Check out the docs, explore real-world examples, and start building your first custom probe today. To stay up-to-date with the latest news and blog posts from Selector, follow us on LinkedIn or X and subscribe to our YouTube channel.

More on our blog

Beyond the Dashboard: Selector’s Patented Approach to Conversational Observability

For years, IT operations teams have been trapped in a frustrating paradox: the data they need to solve critical issues is right at their fingertips, yet entirely out of reach. Accessing it requires engineers to master complex, platform-specific query languages, dig through endless layers of dashboards, and hunt for the exact visualization that holds the answer. Under the intense pressures of modern speed, scale, and complexity, this rigid model is breaking down. At Selector, we recognized a fundamental opportunity to change how teams interact with their data. Our recently published U.S. patent application (US20250278401A1, filed March 2, 2024, and published September 4, 2025), titled “Dashboard metadata as training data for natural language querying,” outlines a transformative solution. By utilizing dashboard metadata, aliases, and user interaction data as training material, we empower operators to bypass structured queries entirely and obtain infrastructure insights using plain, natural language. The Core Innovation: Dashboards as Operational Intelligence Historically, dashboards have been viewed as the final destination for data—a static visualization tool. Selector flips this paradigm. We treat the dashboard as a rich source of operational intelligence and a single version of the truth. The patent details how our platform uses existing dashboard metadata to build dynamic alias datasets. These datasets effectively map natural language phrases to the correct operational context. Because the system leverages the existing organization, labeling, and usage patterns already established in an environment, it doesn’t have to learn from scratch with every user request. It already speaks your network’s language. Changing the Operator Experience This approach fundamentally redefines the operator experience. Instead of forcing an engineer to “think like a query engine,” Selector allows them to simply “think like an operator.” When an issue arises, a user can ask, “Why is packet loss increasing in the west region?” without needing to hunt through widgets or write complex syntax. The system instantly interprets the natural language request, identifies the necessary context, generates the underlying database queries, and returns real-time (or near-real-time) performance data. Capturing “Tribal Knowledge” This innovation goes far beyond a UI upgrade; it represents a major shift in how operational knowledge is institutionalized. Most operations centers rely heavily on “tribal knowledge”—the unwritten expertise of senior staff who inherently know which metrics matter, which dashboards to check, and what specific terms mean in their unique environment. Selector’s patented method converts this implicit expertise into durable training data. As users interact with the system, their natural language inputs continuously augment the alias dataset. The model aligns itself with the customer’s actual domain language, growing smarter and more accurate over time. Scaling Operations and Lowering the Skill Barrier For teams tasked with managing unprecedented scale, this adaptive approach is a game-changer. Traditional natural-language-to-query systems often fail because they require constant manual labeling and retraining whenever new terminology emerges. Selector’s patent directly solves this inefficiency. Our adaptive method automatically updates the alias dataset based on dashboard metadata and user language, even extrapolating new query templates before they are explicitly encountered. This drastically reduces the need for manual labeling while driving high relevance in highly specific, domain-heavy environments. The operational benefits are immediate and measurable: The Architectural Foundation Crucially, this conversational layer doesn’t exist in a vacuum—it is built on a powerful architectural foundation. The patent describes an operations management system capable of ingesting, normalizing, and labeling heterogeneous operational data from multiple sources before generating and executing queries against it. For AIOps and observability, this highlights a foundational truth: natural language querying is only effective when it rests atop a platform that is already proficient in data correlation, normalization, and contextual retrieval. The Future is Conversational Ultimately, this isn’t just about making dashboards easier to use. It is about transforming the relationship between humans and operational systems. Dashboards are evolving from passive displays into active learning agents. By moving operational data beyond static visualization and into the realm of conversational access, Selector lets the system learn the operator’s language—rather than forcing the operator to learn the system’s. We are delivering on the ultimate promise of AIOps: turning your operational data into a resource you can converse with, rather than just a dashboard you have to search. Stay Connected Selector is helping organizations move beyond legacy complexity toward clarity, intelligence, and control. Stay ahead of what’s next in observability and AI for network operations: 

The Business Case for AI-Driven Observability in Network Operations

Modern network operations generate an extraordinary amount of telemetry. Metrics, logs, events, topology data, cloud signals, and service context all contribute to a richer picture of system behavior. As environments expand across cloud, data center, edge, and SaaS, the opportunity for operations teams is clear: when that telemetry is unified and understood in context, it becomes a powerful source of resilience, efficiency, and business insight. That is why AI-driven observability has become such an important priority for IT and operations leaders. Its value comes from helping teams move through complex environments with greater clarity. Correlated signals, contextual awareness, and shared operational understanding help teams identify issues faster, coordinate more effectively, and resolve incidents with greater confidence. For business leaders, the conversation is increasingly practical. They want to understand how observability investments contribute to uptime, team productivity, operational scale, and service quality. AI-driven observability answers that question by connecting technical insight to measurable operational outcomes. AI-Driven Observability Creates Shared Operational Context One of the most valuable outcomes in modern operations is shared context. Network, infrastructure, cloud, and application teams all work with data that reflects real conditions in the environment. When that information is connected across domains, teams can align quickly around what is happening, what is affected, and where to focus first. Previous articles we’ve written point to this operational need consistently. Full-stack visibility, event correlation, data harmonization, and contextual intelligence all support the same outcome: helping teams see systems as interconnected environments. This gives engineers a clearer path from telemetry to understanding, and it helps leaders create more consistent operational workflows across distributed environments. Shared context also improves collaboration during incidents. A unified operational view helps teams work from the same narrative, which supports faster triage, clearer ownership, and smoother coordination across functions. In high-pressure moments, that alignment has direct business value because it reduces confusion, accelerates decisions, and supports service continuity. Business Value Begins With Faster Understanding In many organizations, the most important operational gain comes from shortening the path to understanding. When engineers have access to correlated, context-rich insight, they can move quickly from detection to investigation and from investigation to action. That acceleration matters because every operational delay carries a cost. Teams invest time in triage, collaboration, handoffs, and escalation. Business services may experience degraded performance. Internal teams lose productivity. Customer-facing systems carry increased risk. AI-driven observability supports a more efficient operating model by helping teams understand relationships across signals and by surfacing the context needed to act earlier in the incident lifecycle. This is one of the clearest ways to express the value of AI-driven observability to executive audiences. Faster understanding improves incident response, strengthens operational discipline, and helps organizations sustain service quality as complexity grows. The Metrics That Show Real Value A strong business case becomes much easier to communicate when it is anchored in a focused set of operational metrics. MTTR Mean Time to Resolution remains one of the clearest indicators of operational effectiveness. AI-driven observability contributes to MTTR improvement by helping teams identify likely cause, affected services, and relevant context earlier in the process. This supports a faster path to action and a more efficient incident lifecycle. Time to Identify Early understanding shapes the rest of the response cycle. A clear view of correlated events, dependencies, and service impact helps teams assign ownership quickly and move forward with confidence. Incident and Ticket Volume Correlated incident management supports a more focused operating model. When related events are grouped into context-rich incidents, teams can work from a smaller number of more meaningful operational objects. That improves efficiency and helps reduce cognitive load across NOC and operations teams. Escalation Patterns High-quality context supports better decision-making at every level of the organization. It allows frontline teams to act with stronger situational awareness and helps senior engineers focus their expertise where it can create the greatest impact. This contributes to healthier team capacity and more scalable operations. Operational Toil Operations leaders increasingly care about the amount of repetitive manual work surrounding incidents: reviewing duplicate alerts, switching across tools, reconstructing timelines, and coordinating repeated handoffs. AI-driven observability supports a cleaner, more streamlined workflow that improves engineer productivity and creates a better day-to-day operating experience. Translating Operational Gains Into Executive Language Executive stakeholders respond most strongly when technical improvements are connected to business outcomes. AI-driven observability lends itself well to that conversation because the operational gains are tangible. Time saved during triage translates into labor efficiency. Faster resolution supports uptime and service quality. More focused incidents help teams scale their efforts across larger, more distributed environments. Better context strengthens planning, prioritization, and cross-team coordination. These outcomes support resilience while also contributing to cost discipline and organizational agility. This is especially important in hybrid operations, where service performance depends on relationships across infrastructure, network paths, providers, and applications. In these environments, observability creates value by helping organizations understand system behavior holistically and act with a stronger operational foundation. AI-Driven Observability Supports Resilient Growth As digital environments grow, the need for clarity grows with them. More services, more interdependencies, and more distributed architectures all increase the importance of context-rich operational intelligence. AI-driven observability helps organizations meet that complexity with a model that supports resilience and scale. Data harmonization, event intelligence, natural language access, intelligent incident management, and agentic workflows all contribute to a future where operational teams can work with greater speed, confidence, and precision. That progression begins with observability that understands relationships across the environment and delivers insights in a form teams can use immediately. A Simple Framework for Proving Value For teams building the business case internally, the clearest approach is often the simplest. Start by establishing a baseline for incident response, escalation patterns, and operational effort. Track the time spent identifying issues, coordinating across teams, and resolving events. Then measure how AI-driven observability improves those workflows through richer context, better alignment, and faster understanding. From there, tie those improvements to the outcomes leadership cares about most: service reliability, productivity, operational scale, and customer experience. This gives observability

Solving the Ticket Noise Problem: What We Learned from Our ServiceNow Webinar

On March 18th, we hosted a session focused on a challenge that continues to undermine even the most mature IT operations teams: ticket noise.  It’s easy to dismiss noise as just “too many alerts”. But as we explored in the webinar, the real issue runs deeper. Ticket noise is a symptom of something more fundamental — a lack of correlation, context, and shared visibility across the stack.  If you weren’t able to attend, this blog walks through the key ideas, examples, and takeaways. And if any of this feels familiar, it’s worth watching the full session.  View “Solving the Ticket Noise Problem: Bringing Intelligence to ServiceNow”.  The Hidden Cost of Tickets Most organizations don’t struggle because they lack monitoring. In fact, the opposite is true — they have too much of it. Over time, teams adopt specialized tools for every layer of the environment: Each tool does its job well within its domain, but incidents don’t respect those boundaries. As discussed in the webinar, what emerges is a fragmented operational model: The result is a familiar pattern: alert storms, duplicated effort, and delayed resolution. To put things more bluntly, it becomes a data correlation problem rather than a monitoring problem.  Why Traditional ITSM Workflows Break Down Platforms like ServiceNow are central to how organizations manage incidents, but they are only as effective as the data they receive. When upstream systems generate noisy, uncorrelated alerts, ServiceNow becomes a reflection of that chaos: In the webinar, we walked through a scenario that highlights this breakdown. A single configuration change triggered an outage, resulting in dozens of alerts across different tools and teams. Each team began investigating independently, without a shared understanding of the root cause. What should have been a single incident turned into a multi-team firefight, slowing resolution and increasing operational risk. Rethinking the Model: From Alerts to Event Intelligence The core idea behind Selector’s approach is simple but powerful: Don’t manage alerts. Understand Events.  Instead of treating ever alert as a separate signal, Selector ingests telemetry across the entire stack — network, infrastructure, application, and cloud — and builds a correlated model of what’s actually happening.  This shift fundamentally changes how incidents are handled:  This is what we refer to as event intelligence — the ability to move from raw signals to actionable insight.  What This Looks Like Inside ServiceNow One of the most important aspects we covered in the webinar is how this intelligence translates into real operational workflows. Selector integrates directly with ServiceNow, but not in the traditional “forward alerts as tickets” sense. Instead, it transforms the structure and quality of what enters the system. Fewer Tickets, Higher Signal Rather than flooding ServiceNow with every alert, Selector creates correlated incidents. In one example shared during the session, a large-scale outage generated thousands of alerts in a traditional tool. Selector reduced that to just a handful of meaningful incidents, with each tied to a clear root cause. This dramatically reduces the cognitive load on engineers and allows teams to focus on resolution instead of triage. Bi-Directional Intelligence Another key differentiator is the bi-directional integration between Selector and ServiceNow. Selector doesn’t just push tickets into ServiceNow, but instead continuously exchanges information: This ensures that both systems remain aligned and eliminates the fragmentation that often occurs between monitoring and ITSM. It also enables smarter workflows, such as: From Basic Tickets to Actionable Context Perhaps the most meaningful shift is in the quality of each ticket. Traditional tickets often require engineers to begin their investigation from scratch. Selector changes that by embedding context directly into the incident: In effect, Selector elevates tickets from simple notifications to decision-ready artifacts, reducing the need for manual investigation and accelerating time to resolution. Real-World Examples To make this tangible, we walked through several real-world scenarios during the webinar. In one case, a failure in a network interface caused cascading issues across multiple access points. Without correlation, this would appear as a series of unrelated device failures. With Selector, the system identified the failing interface as the root cause and generated a single, context-rich incident, allowing the team to resolve the issue in under 30 minutes. In another example, a large SD-WAN outage impacted over 100 devices across dozens of sites. While other tools generated thousands of alerts, Selector reduced the situation to just a few actionable incidents. Engineers were able to coordinate quickly and focus on resolution rather than filtering out noise. These aren’t edge cases. These represent what happens when correlation is applied at scale. Why This Matters Now As environments become more distributed and complex, the cost of noise continues to rise. It’s not just about wasted time, but also: The organizations that succeed are the ones that move beyond monitoring and toward intelligent operations, where systems don’t just detect issues, but help explain and resolve them. The Takeaway Ticket noise isn’t solved by adding more filters, rules, or dashboards. It’s solved by changing how data is understood. By correlating events across the stack and delivering that intelligence into systems like ServiceNow, Selector enables teams to: Watch The Full Webinar This blog captures the core ideas, but the full session goes deeper into: Watch the full webinar on demand here.  Stay Connected Selector is helping organizations move beyond legacy complexity toward clarity, intelligence, and control. Stay ahead of what’s next in observability and AI for network operations: 

This site is registered on wpml.org as a development site. Switch to a production site key to remove this banner.