Selector CUSTOMER Case StudY
Selector Enables Comprehensive Monitoring of SD-WAN for a Managed Service Provider
About The Customer
- Managed Services Provider (MSP) of SD-WAN solutions
Selector Data Inputs
- SD-WAN analytics REST API
- The MSP’s internal NPM and telemetry tooling
The Challenge
Software-Defined WAN (SD-WAN) solutions are the new go-to technology for building enterprise networks because of the potential cost savings and ability to decouple the network from a single service provider into many providers. These platforms are managed by centralized software that, in addition to controlling the network, provide numerous dashboards for quick visibility of the health of the enterprise network, the application, and much more.
Unfortunately, despite the substantial increase in data and metrics, the vendor-provided analytics platforms fall short of their promises. For example, site health is often derived from only a single metric (successful ping response), ignoring other critical factors such as tunnel status, hardware faults and WAN performance.
Customer Objectives
- Quickly identify root cause of customer-impacting issues
- Provide analytics in the customer portal that show meaningful network health status and causes
The Selector Solution
In order to effectively solve this customer problem, Selector creates a new health metrics per site, derived from the raw data provided from the SD-WAN API as well as the MSP’s synthetic testing tool.
Customer-Specific Views: Tunnel Health
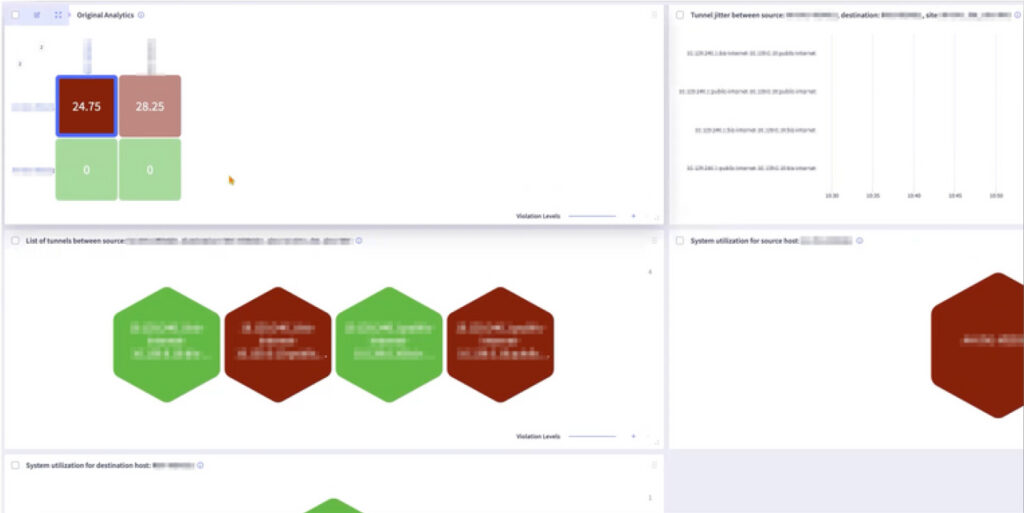
Troubleshooting tunnel performance requires looking at both ends of the tunnel to determine if the cause is site-specific, and if so, which site. If neither site is experiencing issues, the problem may be with the Internet path.
Drilling down into a tunnel that is showing the aggregate health metric takes the user to an at-a-glance view of the key parameters to identify the root cause.
Infrastructure Analytics
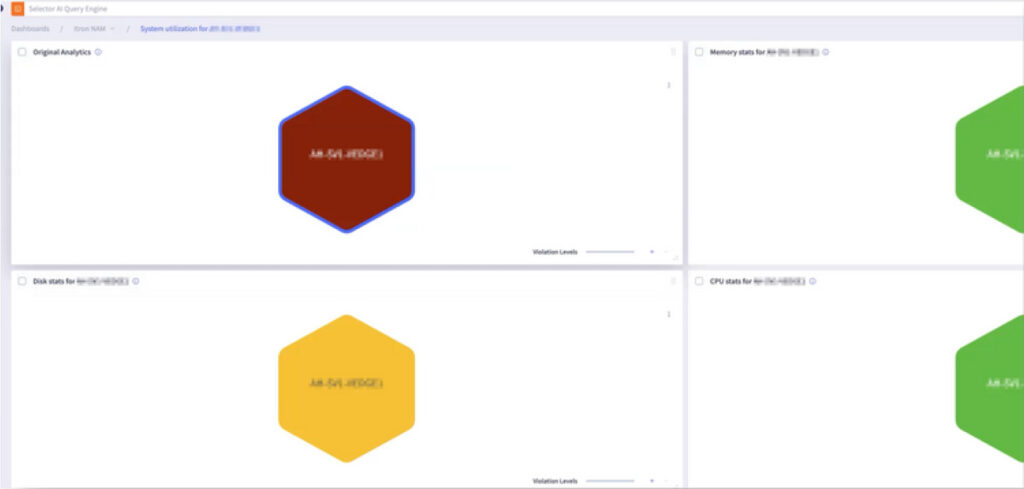
Overall device health can be impacted by any number of system problems: CPU utilization, memory utilization, failing disks, fan failures or other environmental problems.
If any one of these specific metrics indicates a problem, the aggregate health metric will reflect the degradation in the color scheme. A quick drill-down into the site instantly reveals the source of the problem.
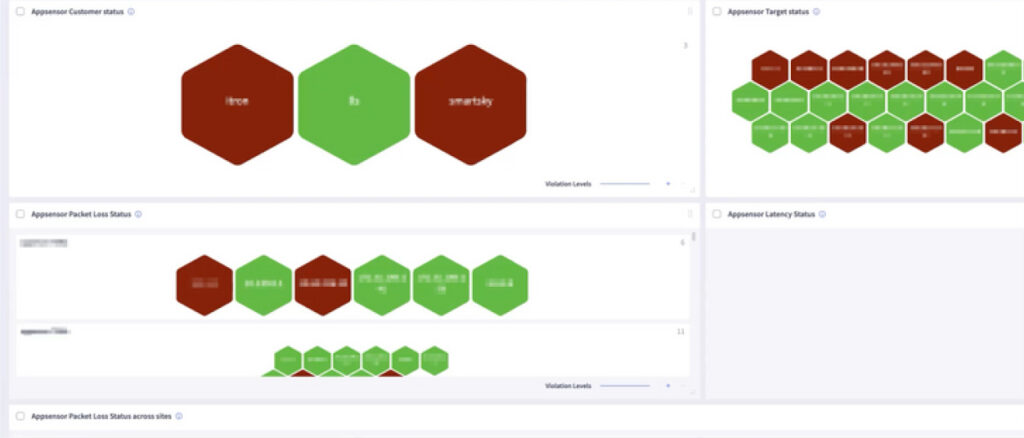
View of All Customers
How nice would it be to look across your entire customer base and instantly know which customers were currently having issues? Creating a new, custom dashboard with the aggregated and derived metrics is simple and gives your operations center (not to mention the VP) a simple view of your whole business in a quick glance.
Summary
Aggregated metrics, derived from multiple metrics and platforms, powered by automated ML algorithms, is a capability used by almost every customer to provide a true single pane of glass for a view of operations, regardless of how many different underlaying systems are collecting data from the network. Our customer can now troubleshoot their end-customer issues more more quickly, as well as automatically provide visuals in their portal so that customers might not need to even open tickets.