Network scale, health, and performance continue to play an increasingly critical role in the modern enterprise. With substantial and ongoing investment in monitoring and observability tools, businesses strive to more efficiently manage their networks and infrastructure. However, a combination of new networking technologies, increasing complexity, and reduced headcount is putting pressure on their disjointed legacy ecosystem.
The Problems with Legacy Tooling
Perhaps the most obvious issue with legacy monitoring and observability tools is the sheer number of them required by a given operations team. Individual tools are often little more than point solutions tailored to the collection and warehousing of specific types of data.
For example, a given tool may specialize in the collection of time series performance data from a particular model of firewall or authentication logs from a specific application. Contrary to vendor marketing, these tools hold limited value beyond their bespoke use cases. As a result, a given environment may require many such tools. The resulting quantity and assortment lead to increased complexity, and in turn, less visibility across a given environment.
This lack of visibility is also due, in part, to a fundamental requirement in leveraging legacy tooling: headcount. All of these tools rely on manual operations to derive value from them. Hands to configure data integrations, set up dashboards, create and tune alerting rules, and account for change within the environment. Eyes to look at all the tools, correlate the data visually, connect the dots, and brains to address the resulting incidents.
As enterprises face steady pressure to improve operational efficiency and reduce headcount, the manual processes required by legacy tooling can simply no longer be accomplished. The frequency and impact of performance issues continue to accelerate. You can barely go a day without reading about an incident or outage — the recent, massive outages at Rogers and Optus come to mind.
Seemingly, we have reached an inflection point for legacy monitoring and observability tooling — the status quo is breaking down, and the results are not pretty.
Unified Monitoring, Observability, and AIOps
The first and only unified monitoring, observability, and AIOps platform, Selector, provides a single pane of glass and key functionality historically addressed by multiple tools. NetOps, DevOps, and SRE teams can collect and analyze telemetry from the network up to their applications – all with a single, unified platform.
Selector’s innovative platform enables operations leaders to address tool sprawl, cut costs, enhance operational efficiency, and focus efforts on improving the customer experience.
Once network and infrastructure data is collected, Selector applies AI and ML to drive powerful features such as event correlation, root-cause analysis, and smart alerting. With Selector, operators gain comprehensive visibility across their network environments and dramatically lower the operational burden in detecting and remediating problems.
Let’s look at some of the key features through which Selector transforms the experience of operators today.
Time Series Anomaly Detection
A historic problem with monitoring systems has been the analysis of time series data. Typically, this process relies on the configuration of static thresholds based on the visual analysis of historical trends.
With Selector, a different approach is taken. Time series data is analyzed using proprietary machine-learning (ML) strategies. Deviations from the expected value — anomalies — are recorded as events. These events are enriched with the context of the originating time series (e.g., model of router, interface ID, location, etc.).
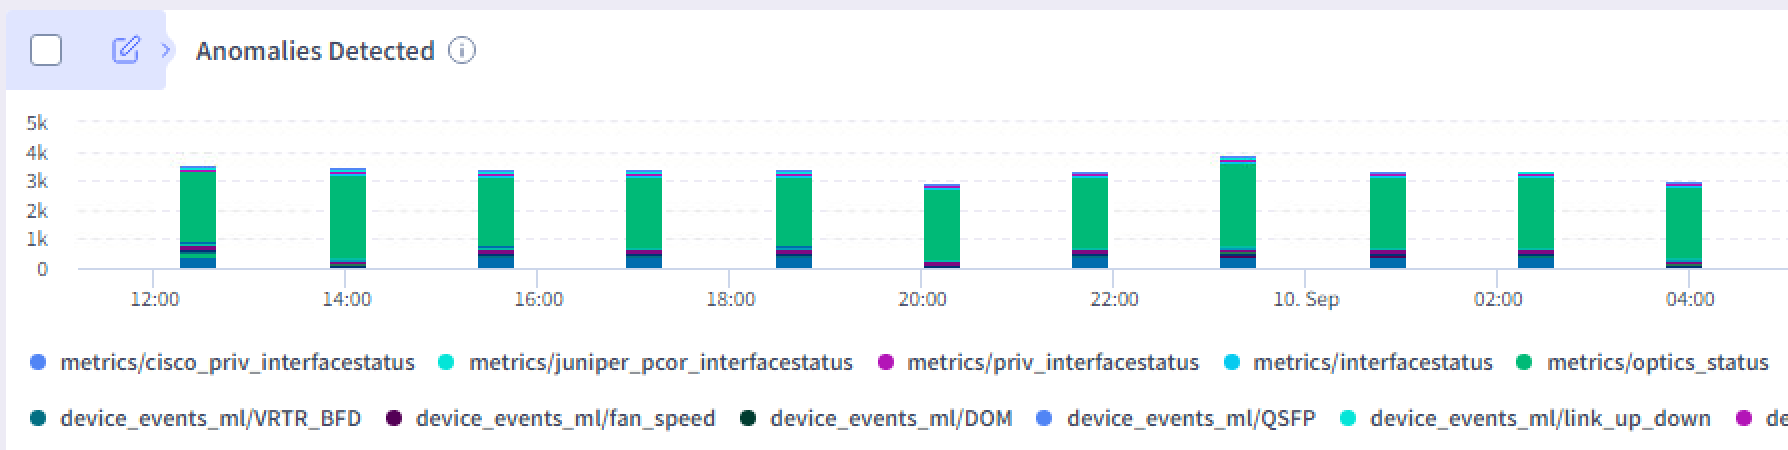
Simply put, you no longer need to manually create and tune alerts. Selector’s AI/ML-driven anomaly detection takes care of this for you.
Log Analytics
Today, most operators leverage a combination of regex and commercial search features to analyze incoming log data and identify unusual behavior or specific entries. These methods are effective, but often time-consuming.
Selector’s Log Miner collects and analyzes log data in real-time with no manual effort. Powered by advanced AI and ML techniques, the resulting analysis filters and clusters log data, detects anomalies, and generates enriched events.
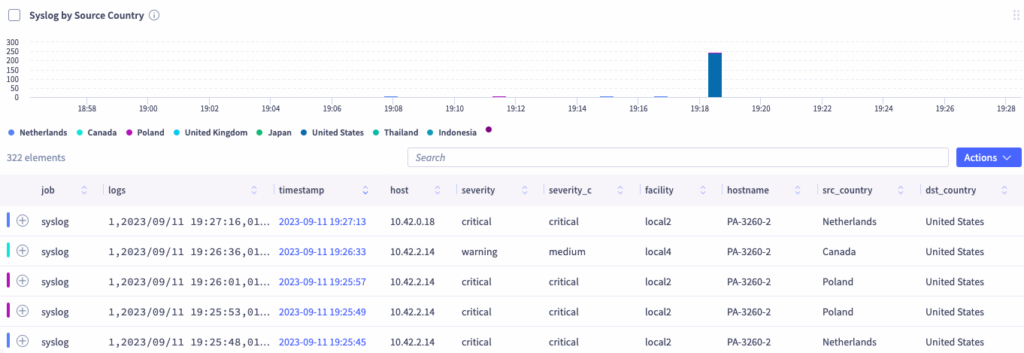
In summary, Selector replaces the burden of manually searching log files with powerful, automated analysis.
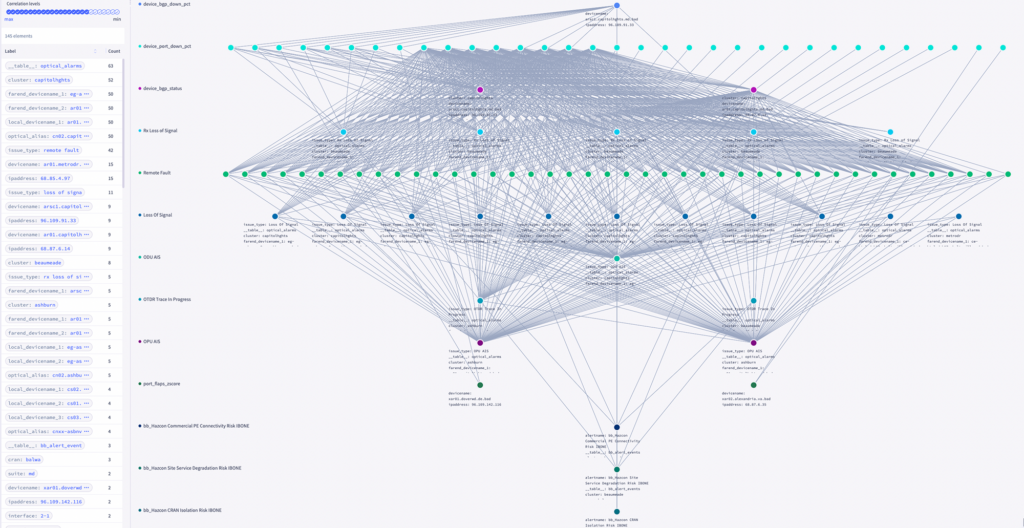
Event Correlation and Root Cause Analysis
Incident investigation and troubleshooting with legacy tools relies heavily on manual effort from operators to visually identify and confirm anomalies in collected data. In this process, 90% of the time spent involves collating, reviewing, and interconnecting the available log and time series data — an intensely manual process. Worse yet, this activity can only begin once the team is notified of a problem.
With Selector, automated correlation is always running in the background. Anomalies from time series and log data are evaluated in real-time, and evolving incidents are instantly correlated, telling you the story of the incident: what was the root cause, when it happened, and what was the resulting fallout.
The resulting correlations can be leveraged in a variety of ways, such as for:
- Smart Alerting
- Ticket Creation
- Guided Remediation
- Automated Remediation
The net result is an improvement to MTTD and MTTR, as the most laborious and time-intensive aspects of troubleshooting are automatically done for the user. What’s more, Selector can identify evolving issues before they impact downstream customers, enabling teams to shift from reactive to proactive workflows.
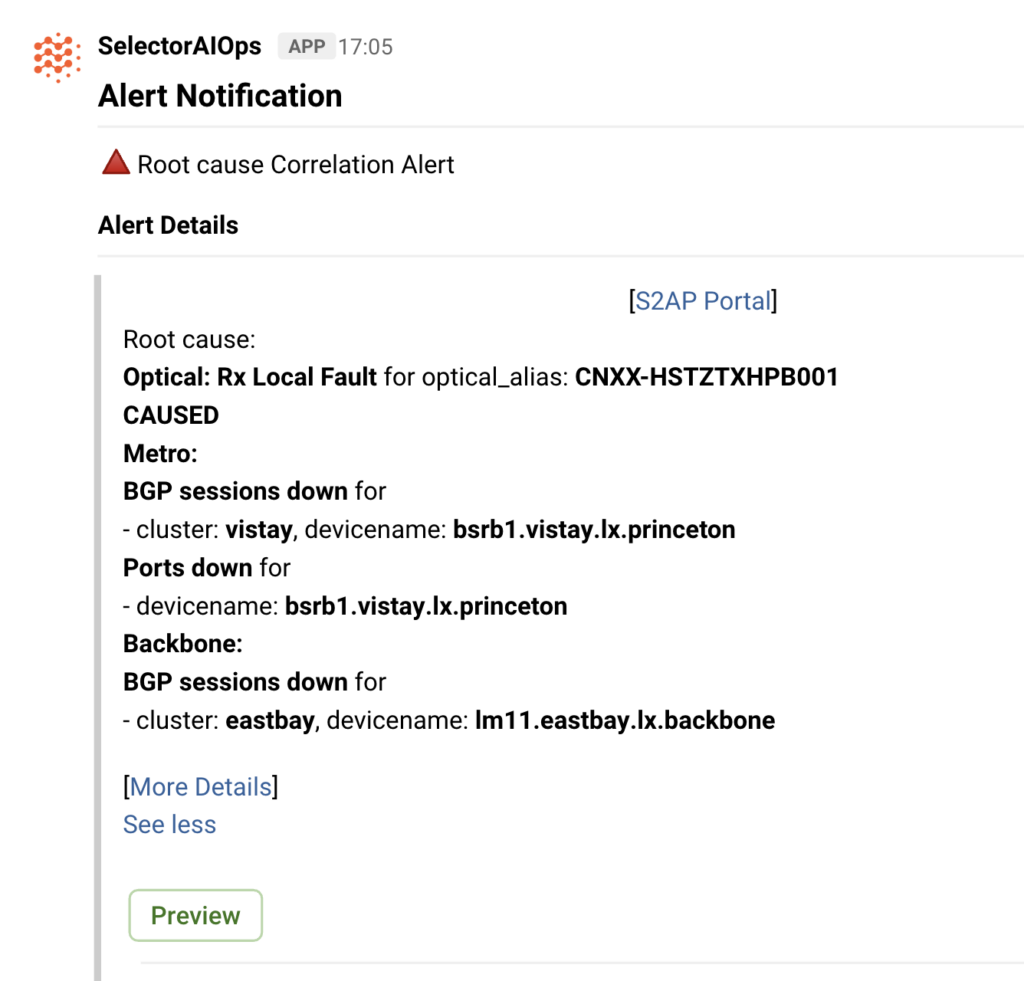
Smart Alerting
Alerting rules manually set by operations staff typically rely on static thresholds. In dynamic environments, these rules effectively go out of date when you create them. Teams quickly learn to guard their time against the distraction of this noisy alerting, and before you know it, outages and performance issues are similarly being ignored.
Selector Smart Alerting changes this dynamic. Smart Alerting leverages current event correlation and root-cause analysis outputs, providing actionable, contextualized information about evolving and ongoing incidents.
Furthermore, Selector Smart Alerting succeeds in the consolidation and deduplication of alerting, reducing the total number of alerts seen by operators. In some cases, deduplication has yielded a 1000:1 reduction in alerts, but more commonly, the reduction is about 75:1, i.e. 98% fewer alerts received.
In effect, Selector provides actionable alerting that guides your team towards the actual problems without wasting their time on noise.
The Promise of AI and ML
The outage experienced by Optus in November 2023 left 35% of Australians (about 10 million people) without internet, cell, or landline services. It impacted banks, hospitals, transit, and government services. Ultimately, Optus suffered a 2 Billion AUD decline in their market cap — more than 5% — as rivals scooped up their customers. The potential magnitude of these incidents will only continue to rise as services increasingly depend on internet connectivity and performance.
With innovative AI/ML-driven features, Selector is uniquely positioned to prevent such crises. By providing comprehensive visibility and insight, our platform enables service providers and enterprises to not only get ahead of issues, but enhance operational efficiency, cut costs, and improve the customer experience.