How AI Finds Root Cause in Minutes Across Hybrid Networks

New Webinar — See how AI eliminates noise and accelerates resolution

How AI Finds Root Cause in Minutes Across Hybrid Networks

New Webinar — See how AI eliminates noise and accelerates resolution

On this page

New Release: Integrated GenAI, Enhanced Monitoring, and More

Selector is excited to give a sneak peek into new features to be included in our forthcoming Spring Release. This release highlights key innovations focusing on integrated generative AI (GenAI) to enable guided troubleshooting and automated incident remediation. It also includes enhancements to several existing features, such as root cause analysis, native monitoring, and observability capabilities.

Get an in-depth look at how these enhancements drive efficiency through tool consolidation and provide transformative insights into the health and performance of network and IT environments.

Spring Release Highlights

The latest Selector release includes:

  • Selector Copilot with GenAI: GenAI combined with Selector Copilot provides instant access to more meaningful incident summaries, assists with troubleshooting, and enables automated remediation. Copilot helps democratize access to your operational telemetry, helping your team access insights quickly.
  • Monitoring and observability: Collect and analyze telemetry from the network to your applications and everything in between. Empower your operations leaders to address tool sprawl and slash monitoring costs. Improve business outcomes with service-level objectives (SLOs) and service-level agreements (SLAs).
  • Root cause analysis: Identify the root cause of an incident through an innovative causal approach, fast-tracking incident investigation and remediation. Additionally, an integrated feedback loop solicits user input, helping to improve correlations and produce more actionable notifications.
  • Digital twin: With Selector, build and leverage digital representations of the network and IT infrastructure. Visualize traffic flows during routing changes and ensure a seamless client experience with improved capacity planning.

Also, in this release, watch for Selector in the Google Cloud Marketplace in Q2. It will enable frictionless software procurement, simplified vendor management, streamlined pricing, and help burn down cloud commits.

Now, let’s dig deeper into each of these highlights.

Selector Copilot with GenAI

Offered as part of the Selector platform, Selector Copilot combines conversational AI with a natural/human language query mechanism. It enables your teams to use retrieval-augmented generation (RAG) to enrich and enhance responses with external data sources. 

Let’s examine an Enterprise Wi-Fi Network use case to help you understand Selector Copilot’s powerful capabilities.

Use case: Enterprise Wi-Fi network 

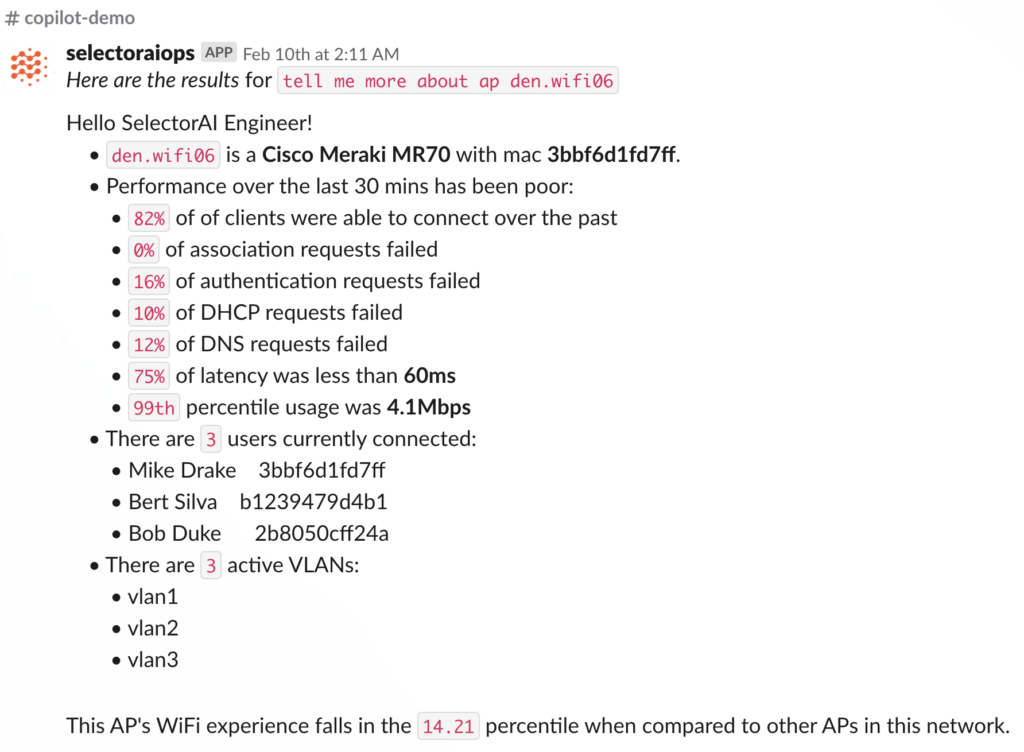
In this use case, the operator uses Selector Copilot to understand the status of a Wi-Fi network for an enterprise, such as a hospital, hotel chain, retail store, or bank. The operator starts with the prompt:

Why is the user experience in a Wi-Fi zone red?

They can then prompt answers to more specific questions:

  • Is the signal-to-noise ratio (SNR) or signal strength indicator (RSSI) not within the permissible limits?
  • Has the Dynamic Host Configuration Protocol (DHCP) Request, DNS Query, or Radius Authentication failed?
  • Why did it fail?

Figure 1 shows this natural language query. Although not shown in this figure, Copilot also includes possible remediations.

Figure 1: Query in natural language on a Slack channel

Monitoring and Observability

With this release, Selector can not only act on top of existing tools, but can directly collect configuration, metric, event, and log telemetry with its native monitoring capabilities.

Selector supports over 500 integrations across networks, infrastructures, clouds, and applications. It also integrates seamlessly with legacy monitoring and observability solutions to provide comprehensive insights into the overall IT environment. 

Once the data is collected, Selector leverages machine learning to detect and identify anomalies. It then suppresses the duplicate and non-actionable events and points towards the root cause of an incident, helping the team reduce mean time to detect (MTTD) and mean time to resolve (MTTR).

Root Cause Analysis

Causal machine learning helps customers identify related issues and events across multiple data sets to find the underlying root cause of an incident.

Figure 2: Root cause analysis in Selector

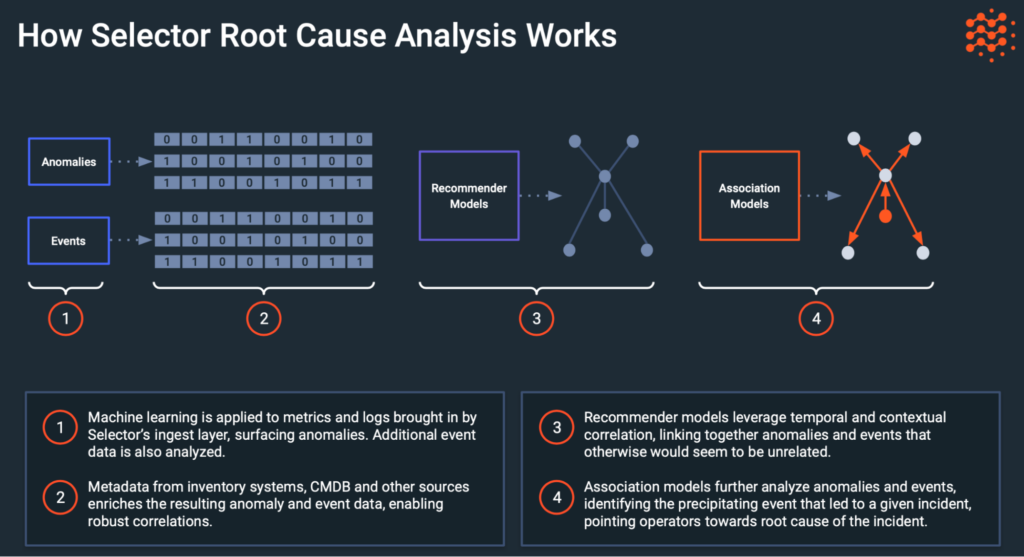
The process follows this flow:

  1. Machine learning is applied to metrics and logs brought in by Selector’s ingest layer, surfacing anomalies. Additional event data is also analyzed.
  2. Metadata from inventory systems, the configuration management database (CMDB), and other sources enrich the resulting anomaly and event data, enabling robust correlations.
  3. Recommender models leverage temporal and contextual correlation, linking anomalies for otherwise unrelated events. 
  4. Association models further analyze anomalies and events, identifying the precipitating event that led to an incident and pointing operators toward the root cause. 

Digital Twin

Create a digital twin of your network and IT infrastructure from the Selector platform. The digital twin feature provides visualization that enables the clients to: 

  • Increase revenue by creating offerings based on low latency and high bandwidth. 
  • Improve SLAs through simulated network failures and routing changes.
  • Browse device capabilities, such as the number of IPv4 addresses a device can hold that impact the number of enterprises that can connect. 
  • Compare the impact of peak loads and design changes, minimizing the maintenance window.
Figure 3: Digital twin of a network and IT infrastructure

Using Selector’s digital twin models to optimize your network/IT resources, you can improve your capital expenditures and reduce operating expenses.

Transformative Insights for Network and IT Ops

Tool sprawl has long plagued operations teams’ pursuit of actionable monitoring and observability. Selector’s unified monitoring and observability and AIOps platform bring disjointed multi-domain telemetry together. The net result is a single pane of glass that helps your team quickly understand what is happening across your IT environment.

Innovative GenAI assists with troubleshooting, automates incident remediation, and meaningfully summarizes incidents, helping the team keep your networks and infrastructure up and running. See Selector in action for yourself. Request a demo.

More on our blog

Beyond the Dashboard: Selector’s Patented Approach to Conversational Observability

For years, IT operations teams have been trapped in a frustrating paradox: the data they need to solve critical issues is right at their fingertips, yet entirely out of reach. Accessing it requires engineers to master complex, platform-specific query languages, dig through endless layers of dashboards, and hunt for the exact visualization that holds the answer. Under the intense pressures of modern speed, scale, and complexity, this rigid model is breaking down. At Selector, we recognized a fundamental opportunity to change how teams interact with their data. Our recently published U.S. patent application (US20250278401A1, filed March 2, 2024, and published September 4, 2025), titled “Dashboard metadata as training data for natural language querying,” outlines a transformative solution. By utilizing dashboard metadata, aliases, and user interaction data as training material, we empower operators to bypass structured queries entirely and obtain infrastructure insights using plain, natural language. The Core Innovation: Dashboards as Operational Intelligence Historically, dashboards have been viewed as the final destination for data—a static visualization tool. Selector flips this paradigm. We treat the dashboard as a rich source of operational intelligence and a single version of the truth. The patent details how our platform uses existing dashboard metadata to build dynamic alias datasets. These datasets effectively map natural language phrases to the correct operational context. Because the system leverages the existing organization, labeling, and usage patterns already established in an environment, it doesn’t have to learn from scratch with every user request. It already speaks your network’s language. Changing the Operator Experience This approach fundamentally redefines the operator experience. Instead of forcing an engineer to “think like a query engine,” Selector allows them to simply “think like an operator.” When an issue arises, a user can ask, “Why is packet loss increasing in the west region?” without needing to hunt through widgets or write complex syntax. The system instantly interprets the natural language request, identifies the necessary context, generates the underlying database queries, and returns real-time (or near-real-time) performance data. Capturing “Tribal Knowledge” This innovation goes far beyond a UI upgrade; it represents a major shift in how operational knowledge is institutionalized. Most operations centers rely heavily on “tribal knowledge”—the unwritten expertise of senior staff who inherently know which metrics matter, which dashboards to check, and what specific terms mean in their unique environment. Selector’s patented method converts this implicit expertise into durable training data. As users interact with the system, their natural language inputs continuously augment the alias dataset. The model aligns itself with the customer’s actual domain language, growing smarter and more accurate over time. Scaling Operations and Lowering the Skill Barrier For teams tasked with managing unprecedented scale, this adaptive approach is a game-changer. Traditional natural-language-to-query systems often fail because they require constant manual labeling and retraining whenever new terminology emerges. Selector’s patent directly solves this inefficiency. Our adaptive method automatically updates the alias dataset based on dashboard metadata and user language, even extrapolating new query templates before they are explicitly encountered. This drastically reduces the need for manual labeling while driving high relevance in highly specific, domain-heavy environments. The operational benefits are immediate and measurable: The Architectural Foundation Crucially, this conversational layer doesn’t exist in a vacuum—it is built on a powerful architectural foundation. The patent describes an operations management system capable of ingesting, normalizing, and labeling heterogeneous operational data from multiple sources before generating and executing queries against it. For AIOps and observability, this highlights a foundational truth: natural language querying is only effective when it rests atop a platform that is already proficient in data correlation, normalization, and contextual retrieval. The Future is Conversational Ultimately, this isn’t just about making dashboards easier to use. It is about transforming the relationship between humans and operational systems. Dashboards are evolving from passive displays into active learning agents. By moving operational data beyond static visualization and into the realm of conversational access, Selector lets the system learn the operator’s language—rather than forcing the operator to learn the system’s. We are delivering on the ultimate promise of AIOps: turning your operational data into a resource you can converse with, rather than just a dashboard you have to search. Stay Connected Selector is helping organizations move beyond legacy complexity toward clarity, intelligence, and control. Stay ahead of what’s next in observability and AI for network operations: 

The Business Case for AI-Driven Observability in Network Operations

Modern network operations generate an extraordinary amount of telemetry. Metrics, logs, events, topology data, cloud signals, and service context all contribute to a richer picture of system behavior. As environments expand across cloud, data center, edge, and SaaS, the opportunity for operations teams is clear: when that telemetry is unified and understood in context, it becomes a powerful source of resilience, efficiency, and business insight. That is why AI-driven observability has become such an important priority for IT and operations leaders. Its value comes from helping teams move through complex environments with greater clarity. Correlated signals, contextual awareness, and shared operational understanding help teams identify issues faster, coordinate more effectively, and resolve incidents with greater confidence. For business leaders, the conversation is increasingly practical. They want to understand how observability investments contribute to uptime, team productivity, operational scale, and service quality. AI-driven observability answers that question by connecting technical insight to measurable operational outcomes. AI-Driven Observability Creates Shared Operational Context One of the most valuable outcomes in modern operations is shared context. Network, infrastructure, cloud, and application teams all work with data that reflects real conditions in the environment. When that information is connected across domains, teams can align quickly around what is happening, what is affected, and where to focus first. Previous articles we’ve written point to this operational need consistently. Full-stack visibility, event correlation, data harmonization, and contextual intelligence all support the same outcome: helping teams see systems as interconnected environments. This gives engineers a clearer path from telemetry to understanding, and it helps leaders create more consistent operational workflows across distributed environments. Shared context also improves collaboration during incidents. A unified operational view helps teams work from the same narrative, which supports faster triage, clearer ownership, and smoother coordination across functions. In high-pressure moments, that alignment has direct business value because it reduces confusion, accelerates decisions, and supports service continuity. Business Value Begins With Faster Understanding In many organizations, the most important operational gain comes from shortening the path to understanding. When engineers have access to correlated, context-rich insight, they can move quickly from detection to investigation and from investigation to action. That acceleration matters because every operational delay carries a cost. Teams invest time in triage, collaboration, handoffs, and escalation. Business services may experience degraded performance. Internal teams lose productivity. Customer-facing systems carry increased risk. AI-driven observability supports a more efficient operating model by helping teams understand relationships across signals and by surfacing the context needed to act earlier in the incident lifecycle. This is one of the clearest ways to express the value of AI-driven observability to executive audiences. Faster understanding improves incident response, strengthens operational discipline, and helps organizations sustain service quality as complexity grows. The Metrics That Show Real Value A strong business case becomes much easier to communicate when it is anchored in a focused set of operational metrics. MTTR Mean Time to Resolution remains one of the clearest indicators of operational effectiveness. AI-driven observability contributes to MTTR improvement by helping teams identify likely cause, affected services, and relevant context earlier in the process. This supports a faster path to action and a more efficient incident lifecycle. Time to Identify Early understanding shapes the rest of the response cycle. A clear view of correlated events, dependencies, and service impact helps teams assign ownership quickly and move forward with confidence. Incident and Ticket Volume Correlated incident management supports a more focused operating model. When related events are grouped into context-rich incidents, teams can work from a smaller number of more meaningful operational objects. That improves efficiency and helps reduce cognitive load across NOC and operations teams. Escalation Patterns High-quality context supports better decision-making at every level of the organization. It allows frontline teams to act with stronger situational awareness and helps senior engineers focus their expertise where it can create the greatest impact. This contributes to healthier team capacity and more scalable operations. Operational Toil Operations leaders increasingly care about the amount of repetitive manual work surrounding incidents: reviewing duplicate alerts, switching across tools, reconstructing timelines, and coordinating repeated handoffs. AI-driven observability supports a cleaner, more streamlined workflow that improves engineer productivity and creates a better day-to-day operating experience. Translating Operational Gains Into Executive Language Executive stakeholders respond most strongly when technical improvements are connected to business outcomes. AI-driven observability lends itself well to that conversation because the operational gains are tangible. Time saved during triage translates into labor efficiency. Faster resolution supports uptime and service quality. More focused incidents help teams scale their efforts across larger, more distributed environments. Better context strengthens planning, prioritization, and cross-team coordination. These outcomes support resilience while also contributing to cost discipline and organizational agility. This is especially important in hybrid operations, where service performance depends on relationships across infrastructure, network paths, providers, and applications. In these environments, observability creates value by helping organizations understand system behavior holistically and act with a stronger operational foundation. AI-Driven Observability Supports Resilient Growth As digital environments grow, the need for clarity grows with them. More services, more interdependencies, and more distributed architectures all increase the importance of context-rich operational intelligence. AI-driven observability helps organizations meet that complexity with a model that supports resilience and scale. Data harmonization, event intelligence, natural language access, intelligent incident management, and agentic workflows all contribute to a future where operational teams can work with greater speed, confidence, and precision. That progression begins with observability that understands relationships across the environment and delivers insights in a form teams can use immediately. A Simple Framework for Proving Value For teams building the business case internally, the clearest approach is often the simplest. Start by establishing a baseline for incident response, escalation patterns, and operational effort. Track the time spent identifying issues, coordinating across teams, and resolving events. Then measure how AI-driven observability improves those workflows through richer context, better alignment, and faster understanding. From there, tie those improvements to the outcomes leadership cares about most: service reliability, productivity, operational scale, and customer experience. This gives observability

Solving the Ticket Noise Problem: What We Learned from Our ServiceNow Webinar

On March 18th, we hosted a session focused on a challenge that continues to undermine even the most mature IT operations teams: ticket noise.  It’s easy to dismiss noise as just “too many alerts”. But as we explored in the webinar, the real issue runs deeper. Ticket noise is a symptom of something more fundamental — a lack of correlation, context, and shared visibility across the stack.  If you weren’t able to attend, this blog walks through the key ideas, examples, and takeaways. And if any of this feels familiar, it’s worth watching the full session.  View “Solving the Ticket Noise Problem: Bringing Intelligence to ServiceNow”.  The Hidden Cost of Tickets Most organizations don’t struggle because they lack monitoring. In fact, the opposite is true — they have too much of it. Over time, teams adopt specialized tools for every layer of the environment: Each tool does its job well within its domain, but incidents don’t respect those boundaries. As discussed in the webinar, what emerges is a fragmented operational model: The result is a familiar pattern: alert storms, duplicated effort, and delayed resolution. To put things more bluntly, it becomes a data correlation problem rather than a monitoring problem.  Why Traditional ITSM Workflows Break Down Platforms like ServiceNow are central to how organizations manage incidents, but they are only as effective as the data they receive. When upstream systems generate noisy, uncorrelated alerts, ServiceNow becomes a reflection of that chaos: In the webinar, we walked through a scenario that highlights this breakdown. A single configuration change triggered an outage, resulting in dozens of alerts across different tools and teams. Each team began investigating independently, without a shared understanding of the root cause. What should have been a single incident turned into a multi-team firefight, slowing resolution and increasing operational risk. Rethinking the Model: From Alerts to Event Intelligence The core idea behind Selector’s approach is simple but powerful: Don’t manage alerts. Understand Events.  Instead of treating ever alert as a separate signal, Selector ingests telemetry across the entire stack — network, infrastructure, application, and cloud — and builds a correlated model of what’s actually happening.  This shift fundamentally changes how incidents are handled:  This is what we refer to as event intelligence — the ability to move from raw signals to actionable insight.  What This Looks Like Inside ServiceNow One of the most important aspects we covered in the webinar is how this intelligence translates into real operational workflows. Selector integrates directly with ServiceNow, but not in the traditional “forward alerts as tickets” sense. Instead, it transforms the structure and quality of what enters the system. Fewer Tickets, Higher Signal Rather than flooding ServiceNow with every alert, Selector creates correlated incidents. In one example shared during the session, a large-scale outage generated thousands of alerts in a traditional tool. Selector reduced that to just a handful of meaningful incidents, with each tied to a clear root cause. This dramatically reduces the cognitive load on engineers and allows teams to focus on resolution instead of triage. Bi-Directional Intelligence Another key differentiator is the bi-directional integration between Selector and ServiceNow. Selector doesn’t just push tickets into ServiceNow, but instead continuously exchanges information: This ensures that both systems remain aligned and eliminates the fragmentation that often occurs between monitoring and ITSM. It also enables smarter workflows, such as: From Basic Tickets to Actionable Context Perhaps the most meaningful shift is in the quality of each ticket. Traditional tickets often require engineers to begin their investigation from scratch. Selector changes that by embedding context directly into the incident: In effect, Selector elevates tickets from simple notifications to decision-ready artifacts, reducing the need for manual investigation and accelerating time to resolution. Real-World Examples To make this tangible, we walked through several real-world scenarios during the webinar. In one case, a failure in a network interface caused cascading issues across multiple access points. Without correlation, this would appear as a series of unrelated device failures. With Selector, the system identified the failing interface as the root cause and generated a single, context-rich incident, allowing the team to resolve the issue in under 30 minutes. In another example, a large SD-WAN outage impacted over 100 devices across dozens of sites. While other tools generated thousands of alerts, Selector reduced the situation to just a few actionable incidents. Engineers were able to coordinate quickly and focus on resolution rather than filtering out noise. These aren’t edge cases. These represent what happens when correlation is applied at scale. Why This Matters Now As environments become more distributed and complex, the cost of noise continues to rise. It’s not just about wasted time, but also: The organizations that succeed are the ones that move beyond monitoring and toward intelligent operations, where systems don’t just detect issues, but help explain and resolve them. The Takeaway Ticket noise isn’t solved by adding more filters, rules, or dashboards. It’s solved by changing how data is understood. By correlating events across the stack and delivering that intelligence into systems like ServiceNow, Selector enables teams to: Watch The Full Webinar This blog captures the core ideas, but the full session goes deeper into: Watch the full webinar on demand here.  Stay Connected Selector is helping organizations move beyond legacy complexity toward clarity, intelligence, and control. Stay ahead of what’s next in observability and AI for network operations: 

This site is registered on wpml.org as a development site. Switch to a production site key to remove this banner.