2025 Gartner® Market Guide for Event Intelligence Solutions
Selector Recognized as a Representative Vendor.
2025 Gartner® Market Guide for Event Intelligence Solutions
Selector Recognized as a Representative Vendor.

On this page

Why Data Harmonization is Critical to Your AIOps Strategy

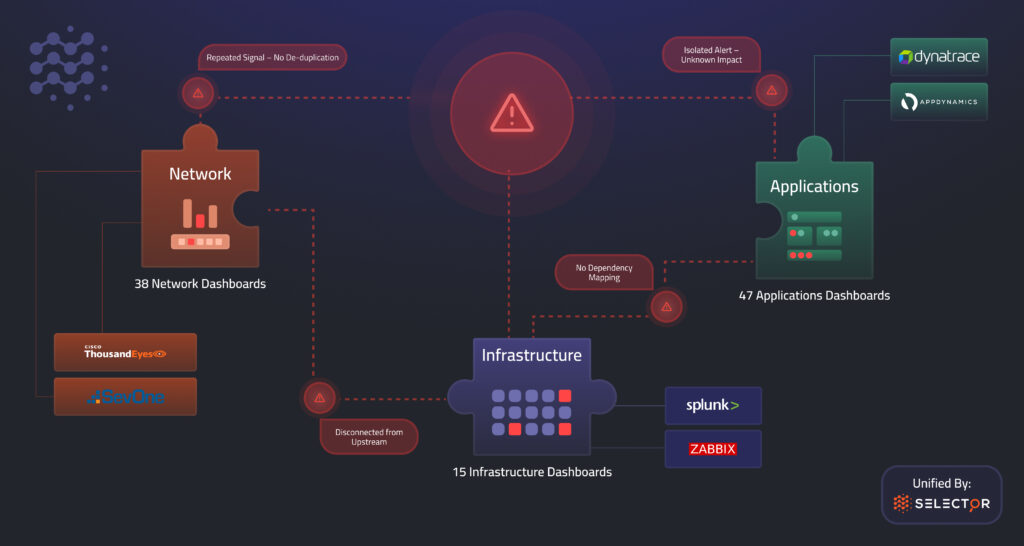
Picture this: Your phone rings in the middle of the night. It’s your engineering lead, calling to inform you of a significant outage affecting your customer-facing services. As your network operations team jumps into action, they’re greeted with chaos. Over 40 alerts flood their screens simultaneously. Your network, infrastructure monitoring, and application performance monitoring tools all fire independently, each with its own dashboard and presenting data in incompatible formats. 

It’s like trying to solve a jigsaw puzzle blindfolded, with pieces scattered across multiple rooms and no map of how they connect. Without full-stack visibility across all layers, valuable time is lost trying to piece together the fragmented clues, which prolongs downtime and costs businesses thousands of dollars per minute. The longer it takes to identify the root cause, the longer your customers and revenue will remain impacted. In scenarios like these, disconnected data isn’t just inconvenient. It’s financially devastating. 

Why Disconnected Data Is Holding Back Network Operations

Today’s enterprises are drowning in data but starving for insights. Operations teams, like in the example above, face the daunting challenge of managing massive volumes of telemetry from across the entire technology stack, spanning network hardware, infrastructure platforms, and distributed applications. Each system and vendor produces data in a different format, resulting in isolated information scattered across dozens of dashboards and tools. As data volumes surge, the task of troubleshooting becomes not only overwhelming but often nearly impossible. 

At the core, this isn’t just a complexity problem. It’s a data quality problem. Before organizations can leverage advanced technology like Artificial Intelligence for IT Operations (AIOps), they must first confront a foundational yet often overlooked challenge: data harmonization.

Illustration of network operators overwhelmed by alerts from multiple dashboards, representing the chaos of disconnected data in modern IT operations.

Introducing Selector’s Data Hypervisor: Your Path to Unified Data

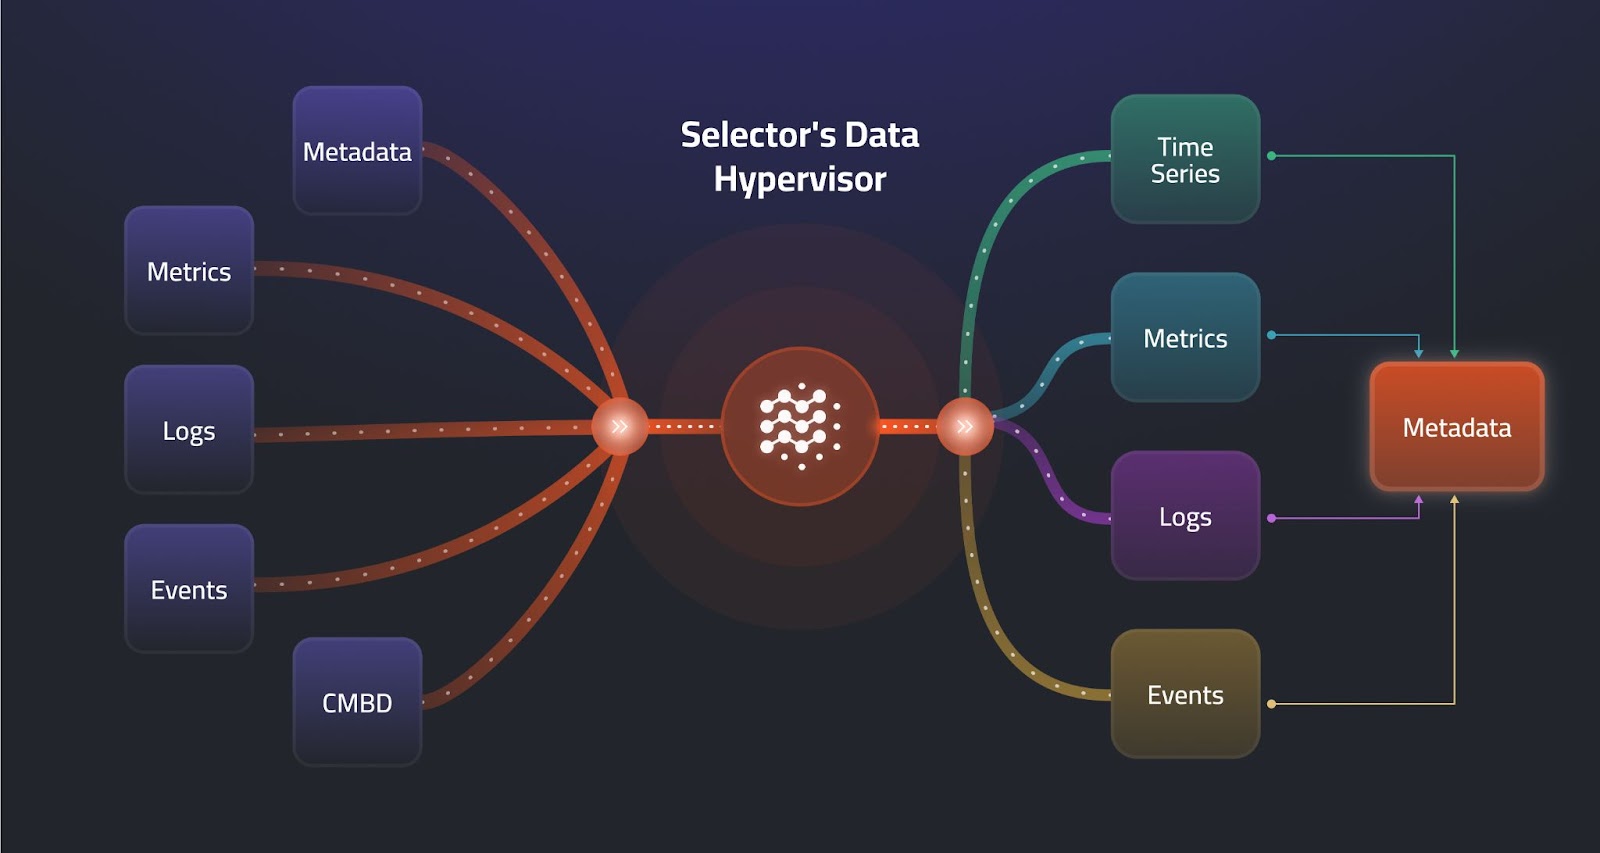
Selector recognized early on that before AI could revolutionize network operations, enterprises first needed a more innovative, more unified way to handle their data. That’s why Selector built its unique Data Hypervisor technology – an innovative approach that transforms the way organizations ingest, enrich, and leverage network, infrastructure, and application data across all seven layers of the stack. 

Much like a virtualization hypervisor decouples physical hardware from the virtual machines, Selector’s Data Hypervisor decouples your diverse data sources from their native formats. The hypervisor ingests every type of operational data imaginable – logs, metrics, events, configurations, operational states, and flow data from networks, infrastructure, and applications – then automatically normalizes and enriches this data to provide a unified, vendor-agnostic view. This data normalization makes previously siloed data streams ready for advanced analytics and unified dashboards, thereby eliminating the need for costly manual correlation. 

But normalization is only part of the story. The Data Hypervisor also enriches incoming data with critical contextual metadata, such as labels indicating location, peer devices, circuit IDs, customer name, or application relationships, making the data more meaningful. Context transforms isolated events into actionable insights, bridging the gaps between siloed tools and datasets. 

Diagram showing how Selector’s Data Hypervisor ingests, normalizes, and enriches telemetry data from networks, infrastructure, and applications.

How Selector Uses Machine Learning to Automate Data Enrichment

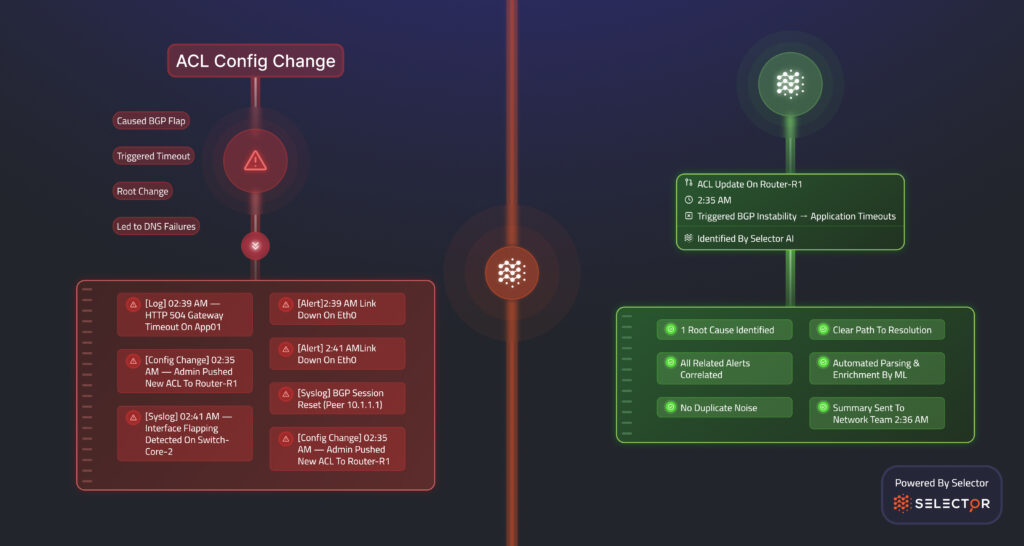
Traditional methods for parsing and enriching data often depend on rigid rules and manually maintained regular expressions. This is a fragile, maintenance-intensive approach. Selector’s Data Hypervisor replaces these outdated methods with advanced machine learning models that automatically interpret and structure unstructured or semi-structured data. 

Rather than needing thousands of handcrafted parsing rules, Selector’s ML-driven approach quickly and accurately extracts relevant information, categorizes events, identifies anomalies, and clusters related issues. This capability drastically reduces manual overhead and error rates, enabling IT teams to shift their focus from managing data to solving actual problems. 

This isn’t just theoretical: Selector customers consistently achieve drastic reductions in alert noise – up to a 98% reduction in ticket volume – enabling teams to focus immediately on real issues. 

Visualization of machine learning models parsing and enriching unstructured data streams to reduce alert noise and support AIOps automation.

Laying the Foundation for AI-Driven Insights

Selector’s approach to data harmonization is more than just operational convenience. It is essential groundwork for full-stack, AI-driven network operations. Studies in machine learning research emphasize that raw data preprocessing is a challenging and time-consuming task that directly impacts model performance, with a substantial portion of raw data requiring transformation before it becomes useful for AI applications. Selector’s meticulous data enrichment and normalization significantly enhance the usability of data collected from all layers, ensuring that the resulting insights and predictions are accurate, actionable, and trustworthy. 

Furthermore, Selector’s solution delivers immediate value. Unlike traditional approaches that require months of extensive setup, Selector can begin providing insights within days, without the need for massive infrastructure investments, such as GPUs. This rapid time-to-value, combined with cost efficiency, makes Selector not only powerful but also practical for businesses looking to make AI-driven operations a reality. 

What’s Next: From Unified Data to Autonomous Networks

Effective AIOps isn’t just about adopting AI tools, but also about thoughtfully preparing your infrastructure to support them. Selector’s Data Hypervisor clears away the chaos, laying a robust foundation for next-level AI applications, such as automated correlation, natural language querying, conversational interfaces, and autonomous network operations. 

In our next blog, we’ll explore how Selector leverages machine learning to correlate network events in real time, unlocking automated insights and laying the groundwork for predictive analytics and AI-driven automation. 

Ready to transform your network operations? Schedule a demo today to see Selector in action, and follow us on LinkedIn or X to be notified of the next blog in this series as we continue your journey toward autonomous network management. 

More on our blog

Key Takeaways From the 2025 Gartner® Market Guide for Event Intelligence Solutions

The 2025 Gartner® Market Guide for Event Intelligence Solutions reflects a shift in how IT operations leaders evaluate AI-driven technologies. As AI hype gives way to more practical evaluation, we are seeing a natural departure from broad promises about AI capabilities toward clearly defined use cases and outcomes.  In their research, Gartner reframes the market formerly known as “AIOps platforms” as Event Intelligence Solutions (EIS), emphasizing correlation, context, and response over generic AI claims. While Gartner examines the evolving role of event intelligence in modern IT operations, we have identified five key takeaways in the market guide. This week, we will share Selector’s perspective on how these ideas translate into real operational value.  Selector is proud to have been identified as a Representative Vendor in the 2025 Gartner Market Guide for Event Intelligence Solution. You can read the full report here.  1. The Market is Resetting Expectations Around AIOps What Gartner says:  “The term AIOps has been widely adopted by vendors across multiple IT operations markets, often without a clear definition of, or consensus on, what it entails. This, coupled with the associated AI hype, has led to both confusion and disillusionment among infrastructure and operations (I&O) leaders, whose expectations have not been met.” “The renaming of this market from AIOps platforms to EIS serves to direct focus to the intended domain and set of use cases. Namely, the application of AI, ML and advanced analytics to cross-domain events from monitoring and observability tools to augment, accelerate and ultimately automate response.” Selector’s perspective:  From our perspective, Gartner’s reframing reflects a broader shift in how operations teams evaluate AI in practice. The challenge was never the potential of AI itself, but the lack of clarity around where and how it should be applied to deliver operational value.  Selector was built with this distinction in mind. Rather than positioning AI as a standalone capability, we focus on applying intelligence to a specific operational domain: cross-domain events produced by monitoring and observability tools. The goal is not to “add AI” to operations, but to help teams augment human decision-making, accelerate response, and progressively move toward automation in areas where confidence and process maturity allow. In other words, AI in and of itself is not the end goal; rather, it is a strategic enabler of the desired outcomes.  We believe this approach mirrors Gartner’s emphasis on use cases and outcomes over terminology. By focusing on event intelligence as a defined operational layer — rather than a broad, catch-all AIOps concept — Selector aims to help teams move past abstract AI promises and focus on measurable improvements in how incidents are understood and handled.  2. Event Noise is the Core Operational Bottleneck What Gartner says:  “It is not unusual for larger enterprises to have portfolios of five to 50 tools for monitoring, each creating signals that must be correlated, triaged and responded to by IT operations teams.” “Often cited by I&O leaders as the key, or only, driver for EIS implementation is this ability to reduce event volumes, in extreme cases this can result in a 95%+ reduction in events that require human intervention.” Selector’s perspective:  We think Gartner’s emphasis on event volume highlights a deeper operational issue: most teams are not overwhelmed because they lack alerts, but because they lack context to understand which signals matter and why.  Selector approaches noise reduction as an outcome of correlation and reasoning, not as a standalone objective. By ingesting events across domains and analyzing their relationships, Selector helps teams distinguish between symptoms and underlying issues. Events that are causally related can be grouped and contextualized, allowing operators to focus on what requires attention rather than manually triaging large volumes of disconnected alerts.  This approach reflects the idea that sustainable noise reduction should reduce cognitive load without obscuring important signals. Rather than simply suppressing alerts, Selector aims to help teams understand how events relate to one another, their impact, and where to begin investigating.  3. Correlation and Context Drive Faster Resolution What Gartner says:  “EIS correlate, group and reduce superfluous notifications from monitoring tools, reducing unnecessary human intervention. In addition, events are enriched with additional contextual information relating to, for example, topology, services, owner or priority.” “Events are additionally enriched with contextual information such as associated impacted business services, prior incidents, change records, owner and even suggested resolver group and remediation action. This correlation and enrichment dramatically reduces the time taken to triage, prioritize, assign and ultimately resolve an event.” Selector’s perspective:  The way we see it, speed in incident response comes from shared understanding, not just faster alert handling. Correlation becomes most valuable when it explains how events relate to one another across domains and what those relationships mean operationally.  Selector focuses on building and reasoning over live service topology and dependencies so that events can be interpreted in context. By linking events to affected services, historical incidents, and changes, Selector helps teams move more quickly from detection to probable cause, reducing the time spent manually assembling context across tools and teams.  This approach is intended to support faster alignment during incidents. When operators can see how events connect, which services are affected, and where to begin the investigation, triage and resolution become more efficient and less reliant on ad hoc communication or escalation.  4. GenAI is Useful, But Only When Grounded in Domain Data What Gartner Says:  “EIS vendors have moved quickly to implement large language model (LLM)- and GenAI-based capabilities, the use cases of which are evolving at pace. Natural language summaries of ongoing issues, providing insights into their possible cause, business impact and next steps are targeted at less technical users.” “The next evolution of these capabilities promises to deliver ever more specialized and sophisticated agentic models targeting broader aspects of the event response and remediation process with expectations being set once again toward fully automated remediation.” “Aside from evaluating the accuracy and ability of GenAI to replace human toil, I&O teams are challenged by their ability to adapt their processes and roles

How Agentic AI is Redefining Network Operations

For much of the past decade, many of the most ambitious ideas in artificial intelligence lived primarily in research papers, labs, and long-term roadmaps. Agentic AI was no exception. The concept of AI systems capable of reasoning, planning, and acting autonomously was widely discussed but largely theoretical. But earlier this month, Gartner® released its report The Future of NetOps Is Agentic, reflecting a growing consensus that this has changed. What was once conceptual is now becoming operational.  We have reached an inflection point where AI research is being translated into real-world systems, and nowhere is this more evident than in network operations. Across IT operations, and especially in NetOps, the conversation is shifting from how AI analyzes data to how AI takes action. This marks a fundamental break from decades of human-centered workflows that simply cannot scale with the speed, complexity, and interdependence of modern networks.  For the first time in the history of NetOps, teams are beginning to explore an entirely new “art of the possible.” AI is no longer confined to dashboards, recommendations, or post-incident analysis. Instead, intelligent systems can continuously observe live environments, reason across domains, and act on behalf of operators in near real time. This marks a redefinition of how network operations function.  This week, we are exploring what Agentic AI means for network operations, why it matters now, and what must be in place for it to succeed.  Transitioning from AIOps to Agentic Operations For a number of years now, AIOps platforms (now called Event Intelligence Solutions by Gartner) have focused on applying AI to one of the hardest problems in IT operations: making sense of overwhelming volumes of events and signals. Solutions like Selector have delivered real, measurable value, reducing noise, accelerating root cause analysis, and improving mean time to resolution through event correlation and contextual enrichment.  However, AIOps was never designed to deliver full autonomy. By nature, it relies on AI models for optimized pattern detection, inference, and recommendation, with humans remaining responsible for decision-making and action. The fact that AIOps stops short of full autonomy is not a shortcoming but rather a reflection of the maturity of the AI technologies and operational modes available when these platforms emerged.  Agentic NetOps represents the next logical evolutionary step, made possible only now as advances in AI architectures, reasoning systems, and operational guardrails begin to close the gap between insight and action. The 2025 Gartner® Market Guide for Event Intelligence Solutions reframes this evolution by focusing on event intelligence as the foundation for automation and decision-making. According to Gartner: “Event intelligence solutions apply AI to augment, accelerate, and automate responses to signals detected from digital services.” The framing around this is critical, and our take is that AI must first understand before it can act. That understanding requires unified events, cross-domain context, and causal reasoning — all of which are capabilities that must precede any form of safe autonomy.  Gartner’s 2026 research report, The Future of NetOps is Agentic, highlights this natural progression: response-focused AI (simple AI chatbots) gives way to task-focused AI (AI assistants), which finally evolves into goal-focused AI (Network AI agents). In other words, Event Intelligence (formerly known generally as AIOps) lays the foundation. Agentic AI then builds on that foundation to introduce systems to go beyond recommending actions and instead continuously reason about the environment and execute on behalf of operators.  What makes AI “Agentic” in NetOps? Agentic AI differs fundamentally from chatbots or task-based assistants. Rather than responding to prompts or executing predefined workflows, agentic systems operate with:  In practical terms, this means AI agents can monitor live networks, detect emerging issues, investigate root cause across domains, and initiate remediation — often faster and at greater scale than human teams.  Gartner notes that generative AI is accelerating this shift by enabling natural language interaction and deeper contextual reasoning: “EIS vendors have moved quickly to implement large language model (LLM)- and GenAI-based capabilities…These capabilities will increasingly be enhanced with retrieval-augmented generation (RAG) or fine-tuning to provide improved context and reduce the risk of hallucinations and inaccurate findings.” Gartner also asserts that: “The next evolution of these capabilities promises to deliver even more specialized and sophisticated agentic models targeting broader aspects of the event response and remediation process with expectations being set once again toward fully automated remediation.” Why Agentic AI is inevitable for network operations Modern networks are no longer static infrastructures. They are dynamic systems spanning cloud, data center, edge, and SaaS, producing massive volumes of telemetry and events every second. Human-centered operations models simply cannot keep pace.  Gartner highlights the operational pressure facing I&O teams:  “Many IT operations teams fail to realize the full potential of event intelligence solutions, realizing a limited value beyond event correlation and noise reduction.” At Selector, we believe the next leap forward comes from closing the gap between insight and action. Agentic AI enables:  In this model, humans are no longer “in the loop” for every decision, but remain firmly “on the loop”, defining intent, guardrails, and trust boundaries. The Prerequisites for Agentic NetOps Agentic AI cannot be bolted onto fragmented tooling or poor data. Gartner repeatedly emphasizes that value depends on data quality, process maturity, and organizational readiness:  “The efficacy of event intelligence solutions is directly related to the sources and quality of data available for ingestion and analysis.” From our perspective, successful agentic operations require:  Without these foundations, autonomy increases risk rather than reducing it. Selector’s Perspective: Agentic AI as a Capability, Not a Feature One of the biggest risks in the current market is superficial “agent washing”, where vendors rebrand chat interfaces or scripts as autonomous intelligence. Gartner warns against this hype-driven approach, noting that AI must be evaluated by its use cases and outcomes, not by terminology.  Selector views Agentic AI not as a single feature, but as a capability that emerges from mature event intelligence. When AI has access to high-fidelity signals, rich context, and causal reasoning, agentic behavior becomes both possible and safe.  This is why Selector has

Making Sense of Complex Data in Observability Tools

Metrics, analytics, measurements, and parameters – can we truly see these abstractions? Data visualization helps us do just that, bridging the gap between raw information and human comprehension. Visualizing data is like rafting down a river – dynamic, unpredictable, and full of discoveries along the way. In this guide, we’ll explore how to craft visualizations that inform, engage, and inspire. So, grab your paddle and hop aboard! Go with the data’s flow The fundamental principle of effective visualization is working with your data’s inherent structure rather than against it. Like water finding its path, data has natural patterns and rhythms that should guide visualization choices. Recognizing whether you’re working with numbers, categories, or time series helps your visuals flow smoothly and convey insight clearly. Finding the perfect chart for your story The human brain loves patterns. Clear, structured visuals make it easier to spot trends, anomalies, and insights. Here’s a brief overview of which chart types best fit different kinds of data. Temporal data Track changes and trends with: Category-based data Compare groups effectively using: Single-value metrics Display key measurements with: Event and status data Visualize occurrences and states through: Numerical datasets Analyze distributions and relationships using: Nested structures Represent layered information with: Location-based data Map spatial information through: Network structures Illustrate system relationships with: Designing for humans  Selecting appropriate visualization types is only half the battle. Even the best-matched chart needs thoughtful UX design to communicate its story honestly. Adopting these core principles will help you transform raw data into clear insights. Designing for real-world data  Simple charts rarely stay simple. A line chart that works for a few series can quickly spiral into chaos with hundreds of series. Here are some of the challenges we encountered – and the design solutions that brought order back. 1. Untangling line charts Building a basic line chart sounds easy – two axes and a ready-made component from a library like Highcharts. But in data-heavy environments, “basic” rarely exists. The backend often delivers dozens of overlapping lines, sometimes on multiple Y-axes, and suddenly the problem shifts from building a chart to making it readable. To bring order to the chaos, our team designed a few key improvements: What started as a simple line plot evolved into an adaptive visualization tool – one that helps users explore data rather than get lost in it. 2. Handling missing data Data is never static – it fluctuates, pauses, and sometimes disappears. Visualizations need to handle all these moments gracefully, from empty timelines to overwhelming data bursts.  In our case, the challenge was visualizing empty states. Simply hiding a widget with no data wasn’t an option – it confused users and broke context. The solution was to differentiate between intentional emptiness and missing data. If an empty state was expected, we showed it clearly. If data was missing, we made that absence explicit. This simple distinction prevented confusion and helped users instantly understand what was happening. 3. Designing beyond color Relying solely on color in data visualizations is risky. Not all users can distinguish hues, large datasets can overwhelm the eye, and assigning a unique color to every data point quickly creates visual clutter. In our product, we found a more reliable approach was logical grouping and structured organization. Whenever possible, we minimized color use, relying on layout, grouping, and contrast to communicate meaning. This not only reduced clutter but also made the design more accessible and easier to interpret. 4. Looking for contrast in Stacked charts Color alone often isn’t enough. In stacked event charts, with many thin layers, maintaining clear contrast can be extremely challenging. While WCAG guidelines ensure high contrast for text and UI elements, there are no universal rules for data visualization – especially when hundreds or thousands of points each need a distinct color. Not using standard status colors like red, green, or yellow for datasets can make differentiation even harder. In our product, we applied several practical strategies to improve readability: By combining careful color choice, thoughtful ordering, and adaptable display modes, we made even densely layered stacked charts clear, accessible, and easy to interpret. 5. Which red is more red Status colors can be surprisingly tricky. Many users have some form of color blindness, cultural associations vary, and too many shades make it hard to remember what each color represents. In monitoring and observability apps, this problem is common: multiple greens, reds, and yellows often appear simultaneously, leaving users to wonder – which red is more severe? Which green indicates optimal health? As a UX designer, I aim to simplify interfaces by reducing status colors to the essentials. One shade each for error (red), warning (orange), and healthy (green) is usually sufficient. When we needed to indicate “almost healthy” widget cells, we faced a design challenge: brief, insignificant errors sometimes triggered a red state, frustrating operational engineers who had to investigate issues that were no longer relevant. Introducing new color shades would have increased cognitive load and emotional impact – which green indicates optimal health? Which red signals real risk? Our solution was elegant and subtle: we kept the original green but added a dotted background. This visually communicated that the status was fundamentally healthy while hinting at minor past turbulence – all without introducing new colors or confusing the user. Building blocks Chart library selection For most charts in our product, we relied on Highcharts. Its demos made it easy to test against our needs, and it covered the majority of our visualizations.  Highcharts is powerful out of the box – a few tweaks deliver interactive, attractive charts. Custom requirements, however, can be tricky. The API is extensive and challenging to navigate, some options override others, and documentation isn’t always complete. Snippets and fiddles help, but logging is limited. Despite these challenges, Highcharts is versatile, handles updates smoothly, and produces high-quality visualizations. A paid license is required, but the effort is well worth it. Table management For advanced tables, we chose AG Grid. It excels at displaying