Anyone who has spent time in a NOC knows how quickly a routine issue can turn into a scramble. A user in a branch office reports that a critical application is unavailable. Slack starts lighting up, dashboards begin to fill with warnings, and before long several teams are trying to answer the same basic question at once: what exactly is broken, where is it broken, and who owns the next move?
The problem is not a lack of data. Most operations teams already have more telemetry, alerts, and dashboards than they know what to do with. The real difficulty lies in turning that flood of signals into a clear understanding of cause and consequence. When every symptom arrives as its own event, teams end up spending valuable time stitching the story together by hand, often while the business is waiting for a resolution.
That is where actionable correlation changes the equation. Instead of forcing operators to bounce between tools and interpret a stream of disconnected alerts, it brings the signals together, identifies what belongs to the same incident, and presents the situation in a way that makes the next step obvious. In practice, that means less time spent assembling context and more time spent actually resolving the problem.
To view a full demo of how events from across the environment are automatically connected to reduce noise and reveal the true root cause behind incidents, view our demo titled “Selector Platform Actionable Correlation”.
Correlation only matters if it leads somewhere
Correlation, on its own, is easy to overvalue. Many platforms can group related events or point to an affected service, but if that information stays trapped inside a dashboard, it only helps up to a point. The work of operations begins when insight moves into workflow—when the incident has enough context, structure, and ownership to drive action.
What the best platforms do well is not just identify a likely relationship between alerts, but turn that relationship into an operational narrative. Instead of presenting a list of symptoms, they show what is affected, how the problem propagates across the environment, and why the issue should be treated as a single incident rather than a dozen separate alarms.

Seen this way, the dashboard stops being a wall of widgets and becomes something much more useful: a working model of the incident. A plain-language summary helps operators orient themselves quickly. A synthetic path makes it easier to understand how the problem is affecting traffic from one part of the network to another. Reachability views and interface status panels provide immediate supporting evidence, while the incident list gives teams a way to see whether what they are dealing with is isolated or part of a broader pattern.
That kind of visibility matters because it changes the first few minutes of a response. Instead of beginning with guesswork, the team begins with context.
The real test is whether the insight reaches ITSM
Of course, even the clearest incident view is not enough if it lives in isolation. At some point the investigation has to become part of the operational system of record, whether that is Jira, ServiceNow, or another internal workflow tool. That transition is where many teams still lose momentum, because moving from observability to execution often means re-entering information manually, rewriting the same summary in multiple places, and hoping everyone stays aligned as the issue evolves.
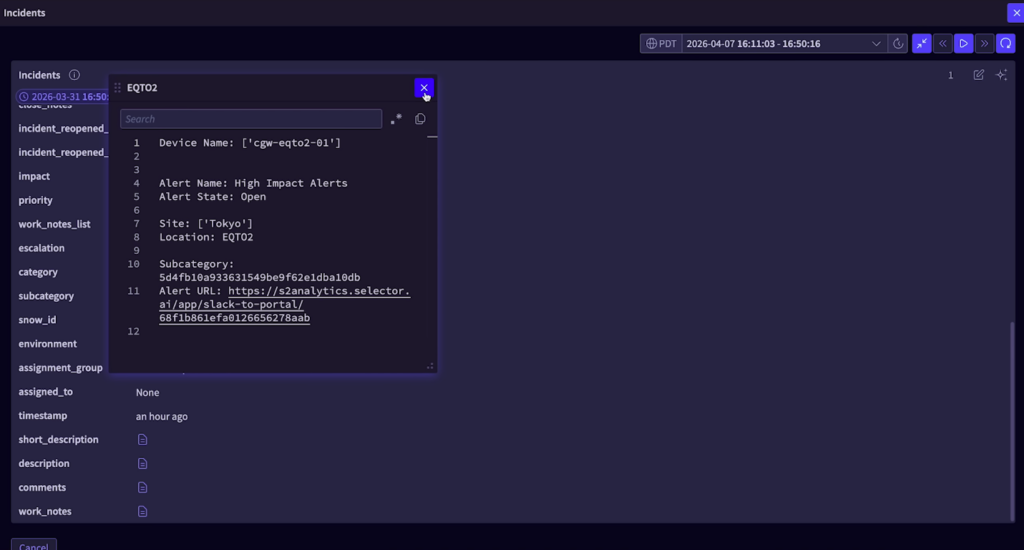
A more mature approach is to let that handoff happen automatically. When a correlated incident is serious enough to require action, the ticket should already contain the essential context: what users are experiencing, which applications or regions are affected, what infrastructure appears involved, and how the issue has been described so far. That removes a surprising amount of friction from the process, especially during the noisy early stages of an outage.

One of the most valuable pieces of that workflow is deduplication. In most real environments, recurring issues do not arrive neatly or politely. A degraded link may trigger repeated alerts across probes, paths, interfaces, and applications. If every recurrence becomes its own ticket, teams very quickly find themselves managing administrative noise instead of the underlying incident.
A better model is to keep those repeated observations tied to the same issue, updating the ticket as the event recurs rather than multiplying it. That may sound like a small design choice, but operationally it is huge. It reduces clutter, preserves continuity, and gives teams a much cleaner record of how often an issue has appeared, how long it has persisted, and what has already been done about it.
A good incident view should support the work, not just describe it
The value of a single-pane incident view becomes especially clear once an incident begins moving between people and teams. In theory, everyone wants a clean handoff. In practice, handoffs often mean hunting through comment threads, reopening the ticketing system, checking whether someone added notes in another console, and trying to reconstruct the latest state from fragments.
That is why bidirectional synchronization matters so much. If operators can view the incident, read the running notes, and contribute updates from the same place where they are already investigating the problem, the platform becomes more than a monitoring surface. It becomes the workspace where the incident actually lives.
This is especially important in organizations that rely on shift-based coverage. When one operator picks up where another left off, they should not have to perform detective work before they can contribute. They should be able to see the history of the incident, understand what diagnostics have already been run, read the notes that matter, and continue the investigation from an informed starting point.
That kind of continuity is easy to underestimate until it is missing. When it is present, teams spend less time retracing steps and more time advancing the resolution.
The next step is not just understanding the problem, but acting on it
Once the incident has been correlated, documented, and handed off into workflow, the next question becomes whether the platform can help move the response forward. In many cases, the most useful first actions are investigative: checking reachability across the path, identifying the exact failing hop, gathering enough evidence to confirm whether the issue belongs to the network, the cloud edge, or an external dependency.
In other cases, the right next step is remedial. A port may need to be reset. An optics workflow may need to be triggered. A predefined runbook may need to execute based on the kind of issue that has been identified. What matters is not that every issue be automated, but that the system can support both diagnosis and response without forcing teams to start from scratch each time.
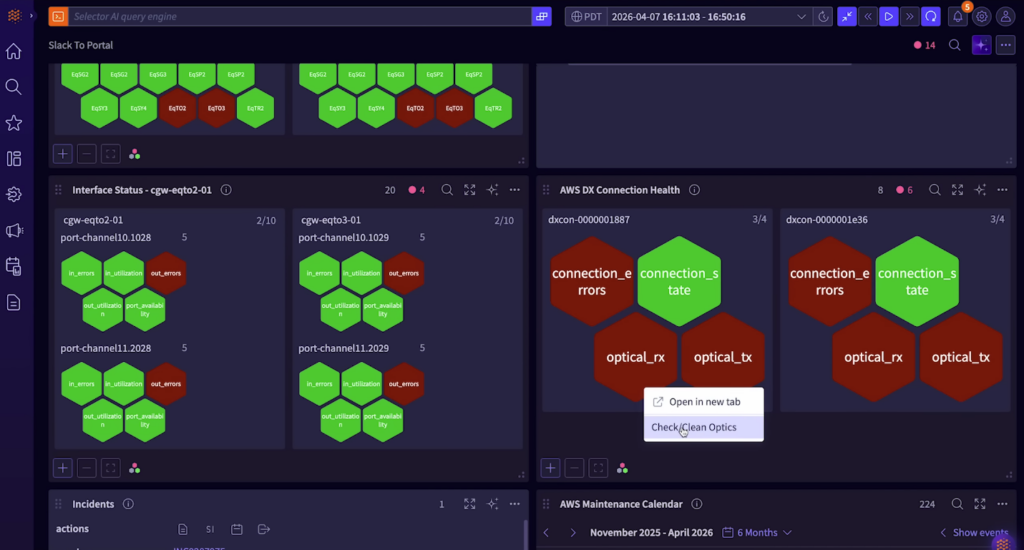
This is where closed-loop automation becomes especially compelling. Rather than treating automation as a separate discipline that lives somewhere else, it appears directly inside the incident workflow, attached to the affected object or path. That makes the operational model feel much more natural. The operator sees the problem, understands the context, and can choose the next action from the same place.
Used well, that does not remove people from the loop so much as remove unnecessary repetition. It frees operators from redoing the same first steps over and over, and it helps ensure that routine responses happen consistently, with the incident record updated as the workflow progresses.
Why this matters more in hybrid environments
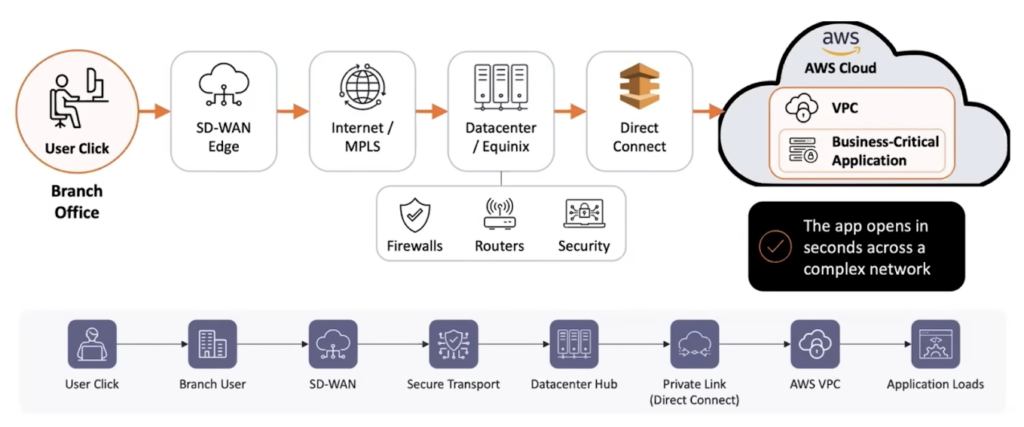
All of this becomes even more important as the path between user and application grows more complicated. A single transaction may begin in a branch office, traverse SD-WAN, move across MPLS or internet links, pass through datacenter infrastructure, and finally reach a cloud-hosted application over Direct Connect or another private connection. From the user’s perspective, there is no distinction between those layers. The application either works or it does not.
For operations teams, though, every one of those layers introduces another place where telemetry can fracture, alerts can multiply, and ownership can become unclear. That is why the old war-room model has become so expensive. It is not just labor-intensive; it is structurally mismatched to the complexity of the environment.
What actionable correlation offers is a more coherent way to manage that complexity. Instead of assembling a war room around every meaningful disruption, teams can work from a single incident, a shared operational view, and a defined next action. That may sound like a subtle shift, but in practice it changes the tone of operations entirely. Response becomes less reactive, less fragmented, and far easier to sustain.
The goal is not to eliminate human judgment. It is to make sure that human judgment is applied where it adds the most value, rather than wasted on stitching together alerts, rewriting notes, or recreating the same ticket context across systems. When that happens, the NOC becomes calmer, faster, and far more effective—not because there is less complexity in the environment, but because the complexity is being handled in a more intelligent way.
Looking Ahead
Selector is helping organizations move beyond legacy complexity toward clarity, intelligence, and control. Stay ahead of what’s next in observability and AI for network operations:
- Subscribe to our newsletter for the latest insights, product updates, and industry perspectives.
- Follow us on YouTube for demos, expert discussions, and event recaps.
- Connect with us on LinkedIn for thought leadership and community updates.
- Join the conversation on X for real-time commentary and product news.


